
IMAGE
Fig. S2
Image
|
Figure Caption
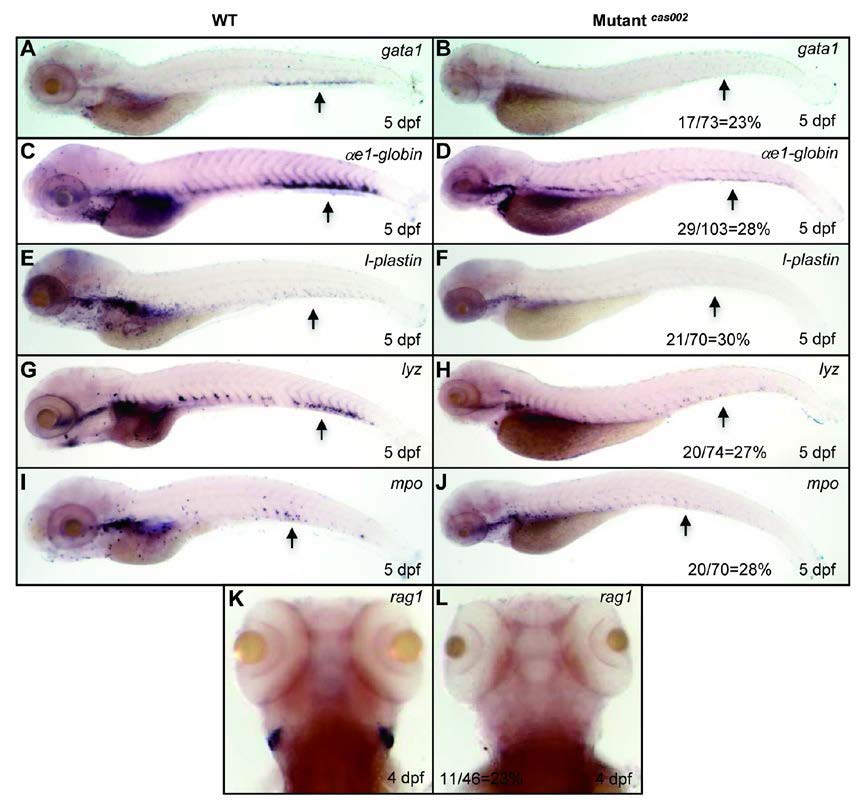
Fig. S2 WISH analysis of hematopoietic lineages at 5 dpf. WISH assays for the expression pattern of gata1, αe1-globin, l-plastin, lyz and mpo in WT and mutantcas002 embryos at 5 dpf. Black arrows indicate CHT regions. T-lymphocyte marker rag1 decreases at 4 dpf in mutantcas002. The number and percentage of het-het incross embryos with the in situ pattern in a clutch are listed at the bottom of the Mutantcas002 panels.
Figure Data
Acknowledgments
This image is the copyrighted work of the attributed author or publisher, and
ZFIN has permission only to display this image to its users.
Additional permissions should be obtained from the applicable author or publisher of the image.
Full text @ Cell Res.