
|
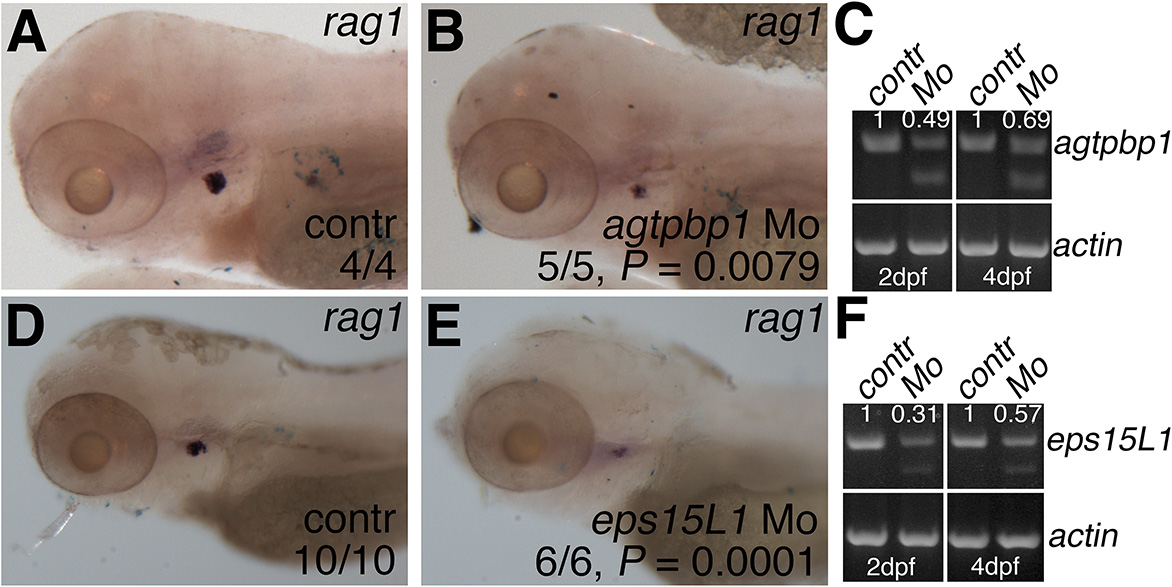
Fig. 6 Morpholino knockdown of agtpbp1 and eps15L1 results in decreased lymphoid rag1 expression.
(A-B) WISH of rag1 in 4 dpf control (A) and agtpbp1 (B) morpholino-injected embryos. (C) RT-PCR of agtpbp1 and β-actin in pooled control or morphant embryo samples. Quantitation of the normal transcript band normalized to ß-actin is indicated. (D-E) WISH of rag1 in 4 dpf control (A) and eps15L1 (B) morpholino-injected embryos. (C) RT-PCR of eps15L1 and ß-actin in pooled control or morphant embryo samples. Quantitation of the normal transcript band normalized to β-actin is indicated. Quantitation is in arbitrary units (A.U.), and relative to wild-type level which is set at 1. Head region of the embryos is shown in lateral views, anterior to the left. P values were determined using Fisher’s exact test.