
Fig. 3
- ID
- ZDB-IMAGE-150810-2
- Genes
- Publication
- Evason et al., 2015 - Identification of Chemical Inhibitors of β-Catenin-Driven Liver Tumorigenesis in Zebrafish
- All Figures
- Figures for Evason et al., 2015
|
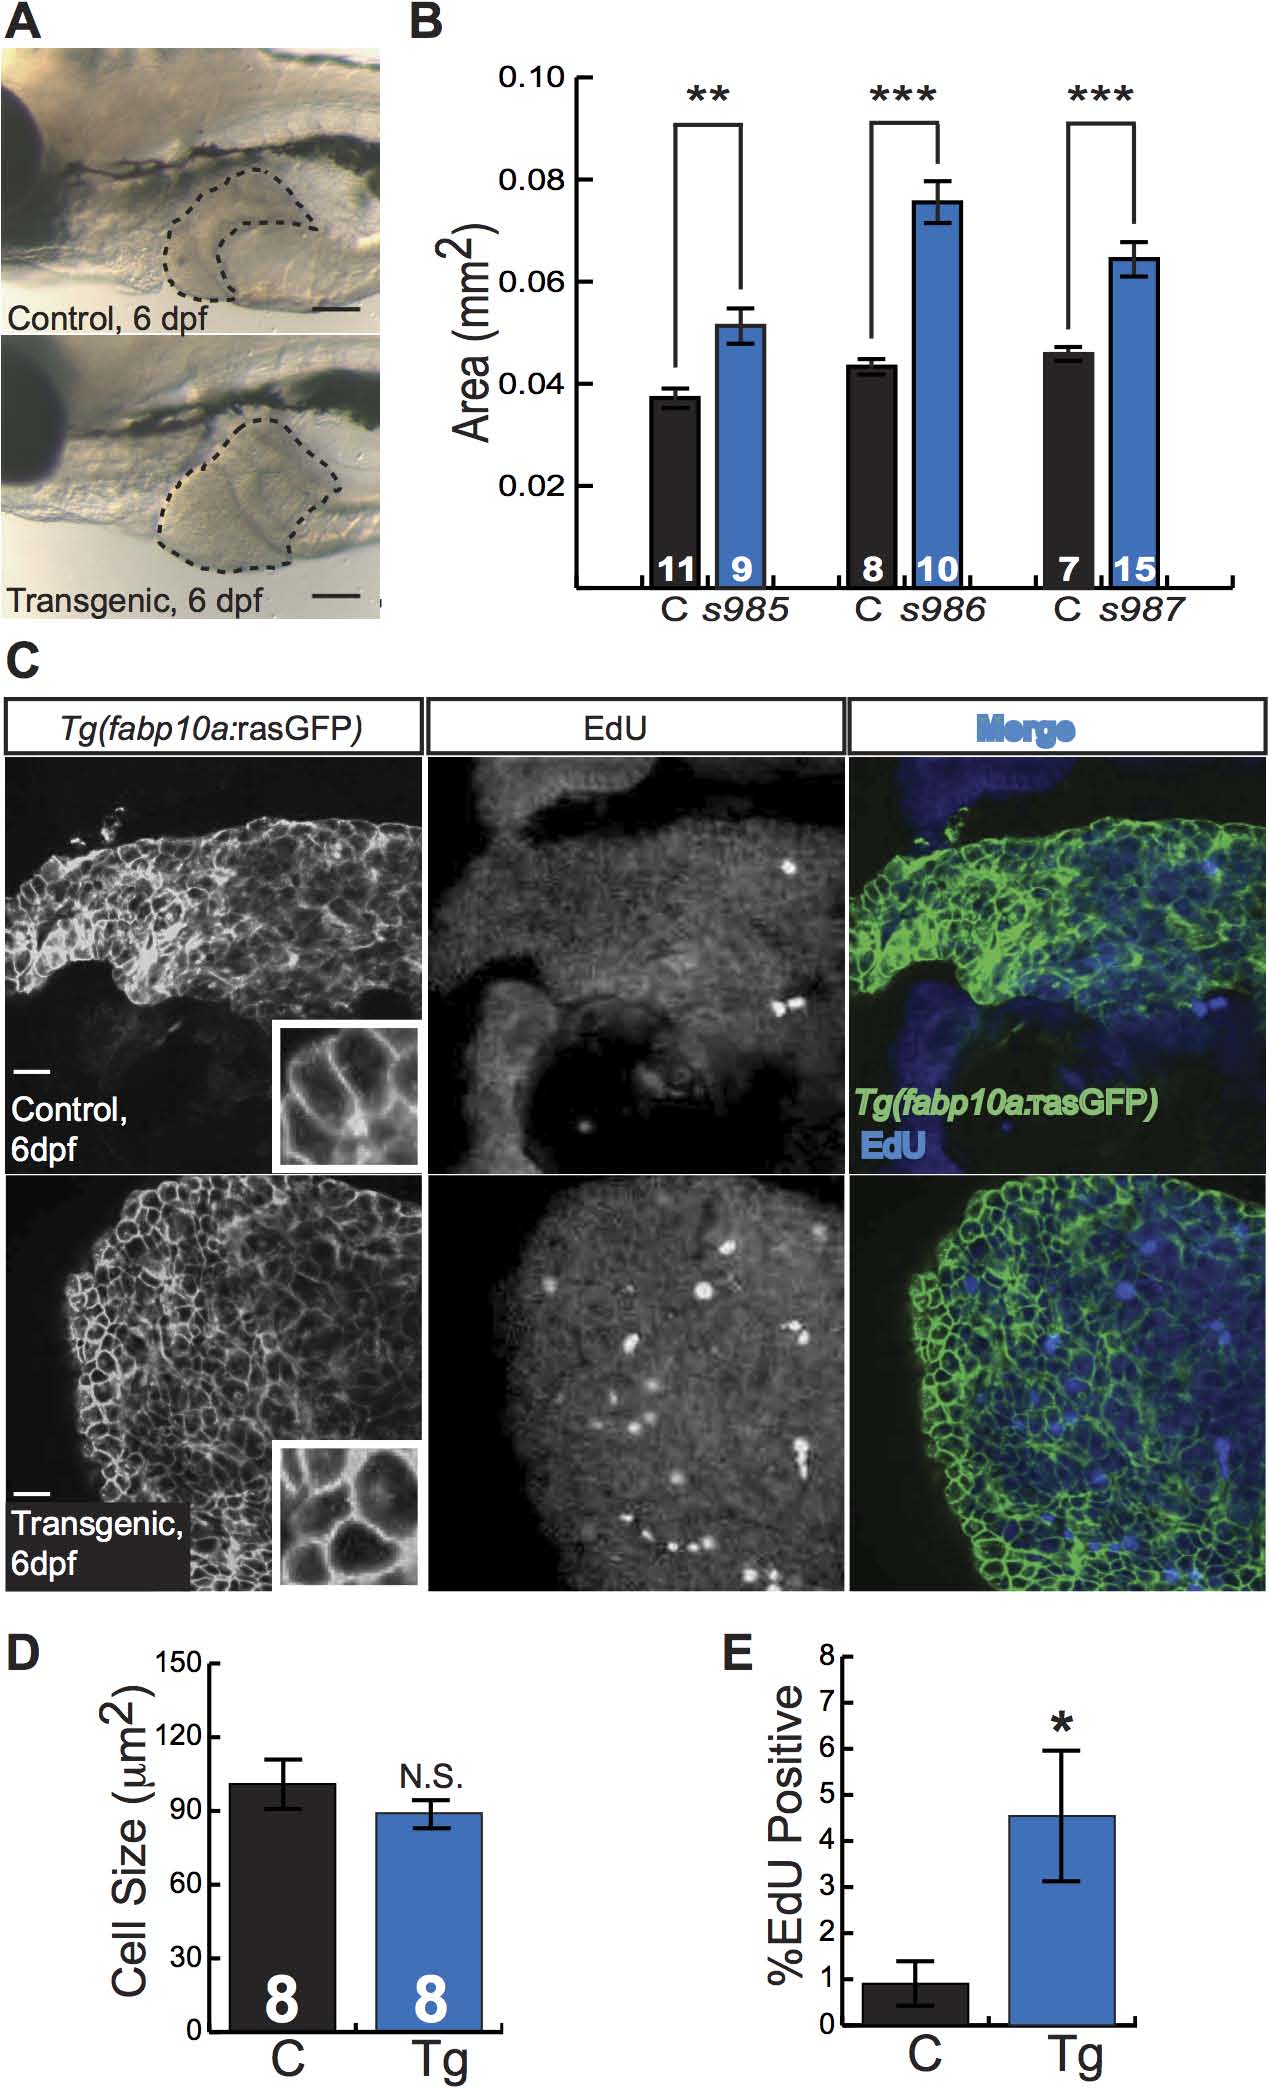
Fig. 3 Activated β-catenin causes larval liver enlargement and increased hepatocyte proliferation.
(A) Brightfield images of control sibling and transgenic 6-day-old fixed larvae. Livers are outlined. Scale bars, 100 µm. (B) Graph showing average liver size ± SEM of 6-day-old larvae from three different transgenic lines (s985, s986, s987) compared to control siblings (C). N values are shown above the x-axis. Asterisks indicate p-values for 2-way ANOVA comparing transgenic zebrafish to control siblings in the same experiment: **, p<0.01; ***, p<0.001. (C) Immunofluorescence images of 6-day-old control and transgenic larvae, highlighting hepatocyte cell membranes (Tg(fabp10a:rasGFP)) and proliferating cells (EdU). Scale bars, 20 µm. Inset photos are 4X magnifications. (D-E) Graphs showing average cell size ± SEM (D) and percent of hepatocytes that were EdU positive (E). N values, which are the same for both graphs, appear above the x-axis in D; samples were compared using the Student’s t-test. *, p<0.05.