
|
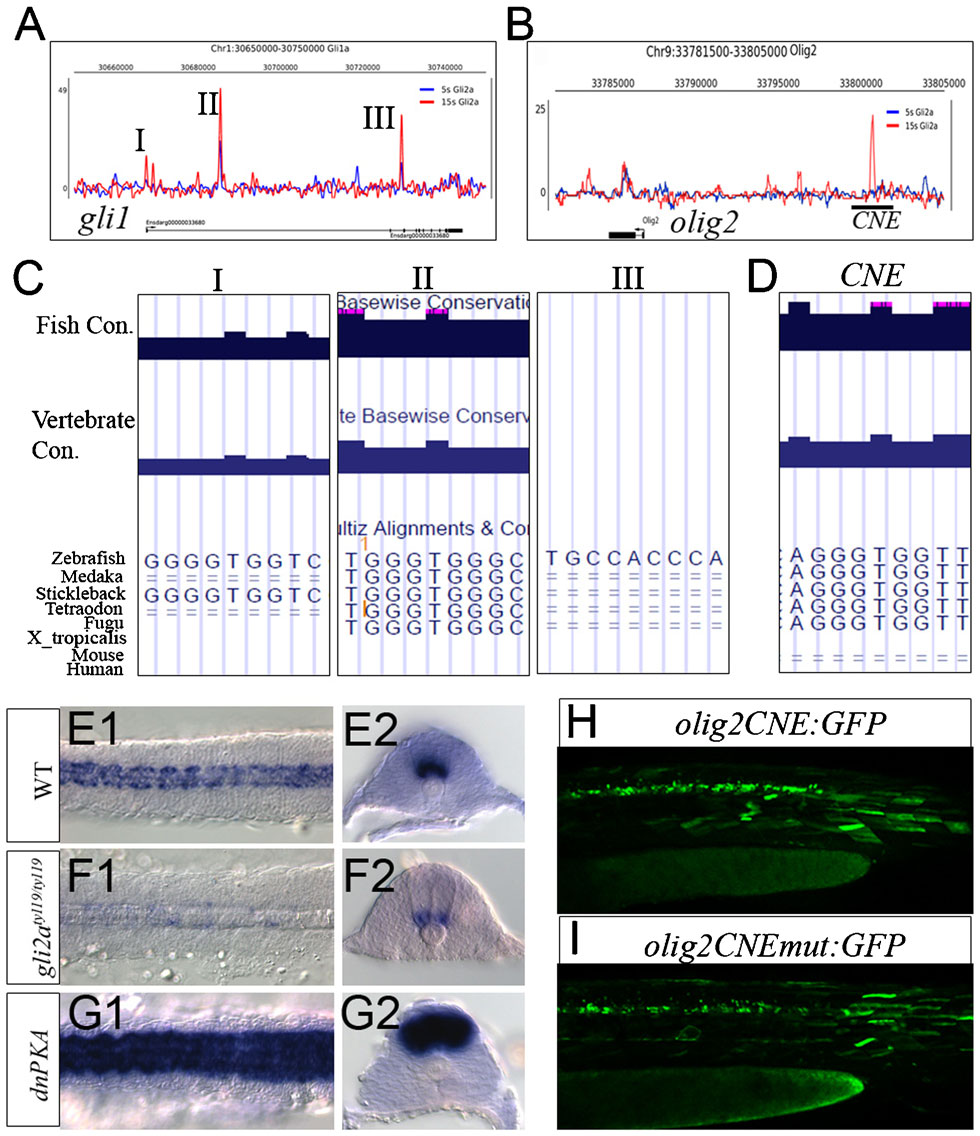
Fig. 6
Gli bound region on gli1 and olig2 genomic locus.
(A) Profile of Gli2a-ChIP sequence enrichment at the gli1 genomic locus. (B) Profile of Gli2a-ChIP sequence enrichment at the olig2 genomic locus. (C) Predicted GBS located within each gli1 peak (I–III) and their conservation between different fish species. (D) Predicted GBS located within the olig2 peak (CNE) and its conservation between different fish species. (E–G) Expression of olig2 transcript in wild-type (E1,E2), gli2aty119 (F1,F2) and dnPKA injected (G1,G2) embryos at the 15 somite stage. Left panels are dorsal view of mesoderm and right panels are section view. (H) Transient expression of GFP driven by a 1.9kb fragment including the CNE (I) transient GFP expression driven by the same 1.9kb fragment in which the GBS was mutated.