
|
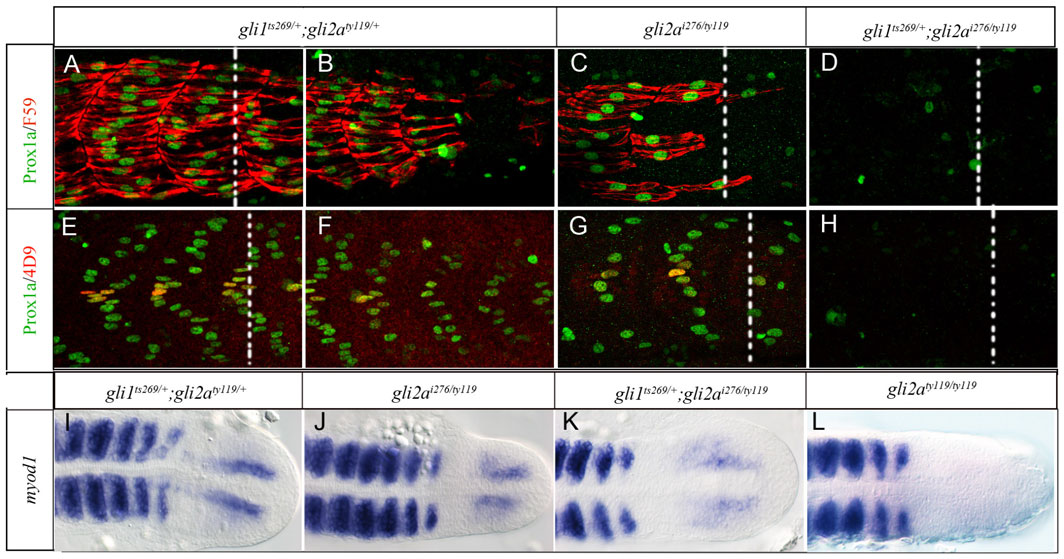
Fig. 4
The Gli1 and Gli2a activators differ in their ability to counter Gli2a-mediated repression.
(A,B,E,F) gli1ts269/+; gli2aty119/+ (C,G) gli2ai276/ty119 (D,H), and gli1ts269/+; gli2ai276/ty119 (D) embryos at 24hpf stained with anti Prox1a (green) and either mAb F59 (red: panels A–D) or 4D9 (red: panels E–H) to reveal slow-twitch muscle and MP fibres. All panels show the caudal somites; the white dotted line indicates the position of the end of the yolk sac extension. The somites shown in panels C and G are located at 3–5 somites away from the end of the yolk sac extension. (I–L) Expression of myod1 in (I) gli2ai276/ty119, (J) gli1ts269/+; gli2aty119/+, (K) gli1ts269/+; gli2ai276/ty119, and (L) gli2aty119/ty119 embryos at 18 ss.