
|
Fig. 2
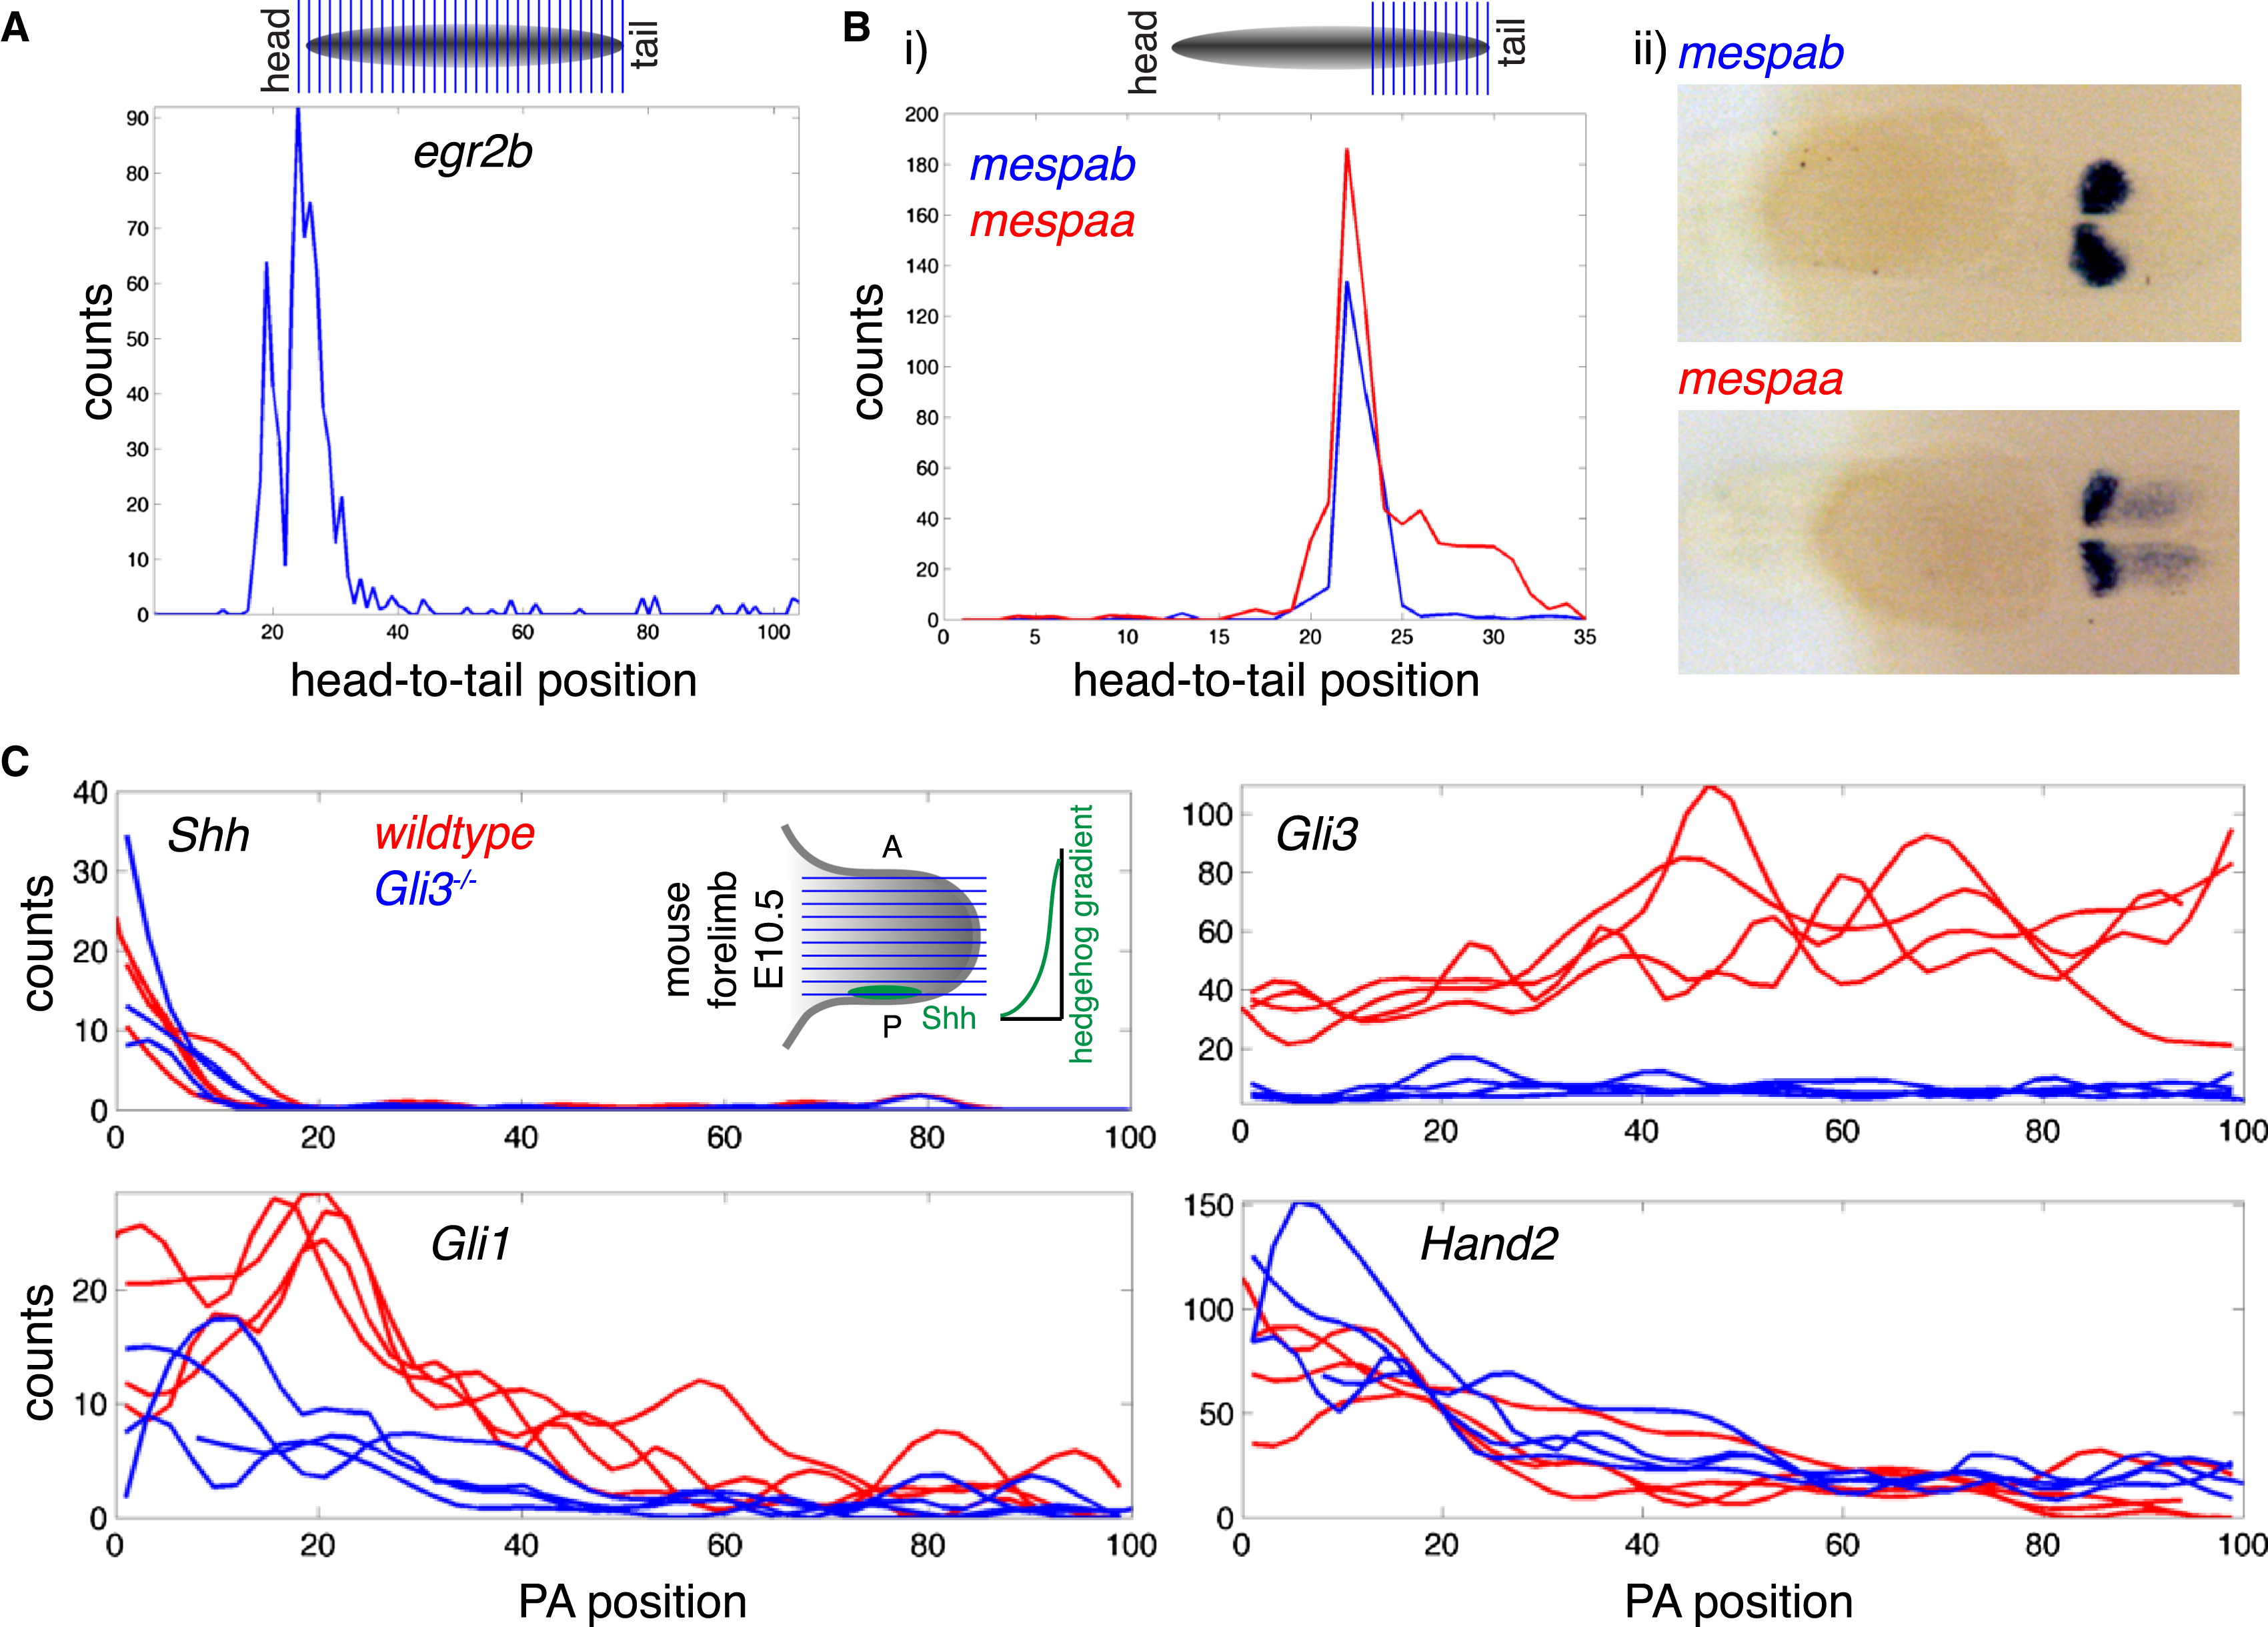
Tomo-Seq Determines Gene Expression Patterns with High Spatial Resolution
(A) Expression trace for egr2b in tail-to-head sample.
(B) Tomo-seq data for posterior end of an 18 somites stage embryo sequenced at higher depth. (i) Expression patterns of mespab and mespaa are very similar, with the exception of a shoulder on the posterior side of the main peak for mespaa. (ii) mRNA in situ hybridization confirms these differential expression domains (view of the tail, posterior to the right). See also Figure S2 and Table S2.
(C) Tomo-seq traces for selected genes along the posterior-to-anterior axis of E10.5 mouse forelimbs (right forelimbs of four wild-type and four Gli3/ littermates). Forelimbs were sectioned as shown in the inset in the top left panel in order to resolve gradients of hedgehog target genes and pathway components. Tomo-seq traces and expression changes in Gli3/ limbs are in full agreement with published whole-mount in situ data (Litingtung et al., 2002).
Reprinted from Cell, 159, Junker, J.P., Noël, E.S., Guryev, V., Peterson, K.A., Shah, G., Huisken, J., McMahon, A.P., Berezikov, E., Bakkers, J., van Oudenaarden, A., Genome-wide RNA Tomography in the Zebrafish Embryo, 662-75, Copyright (2014) with permission from Elsevier. Full text @ Cell