
Fig. 3
|
Fig. 3
Expression patterns of each transducin subunit gene in the adult zebrafish retina.
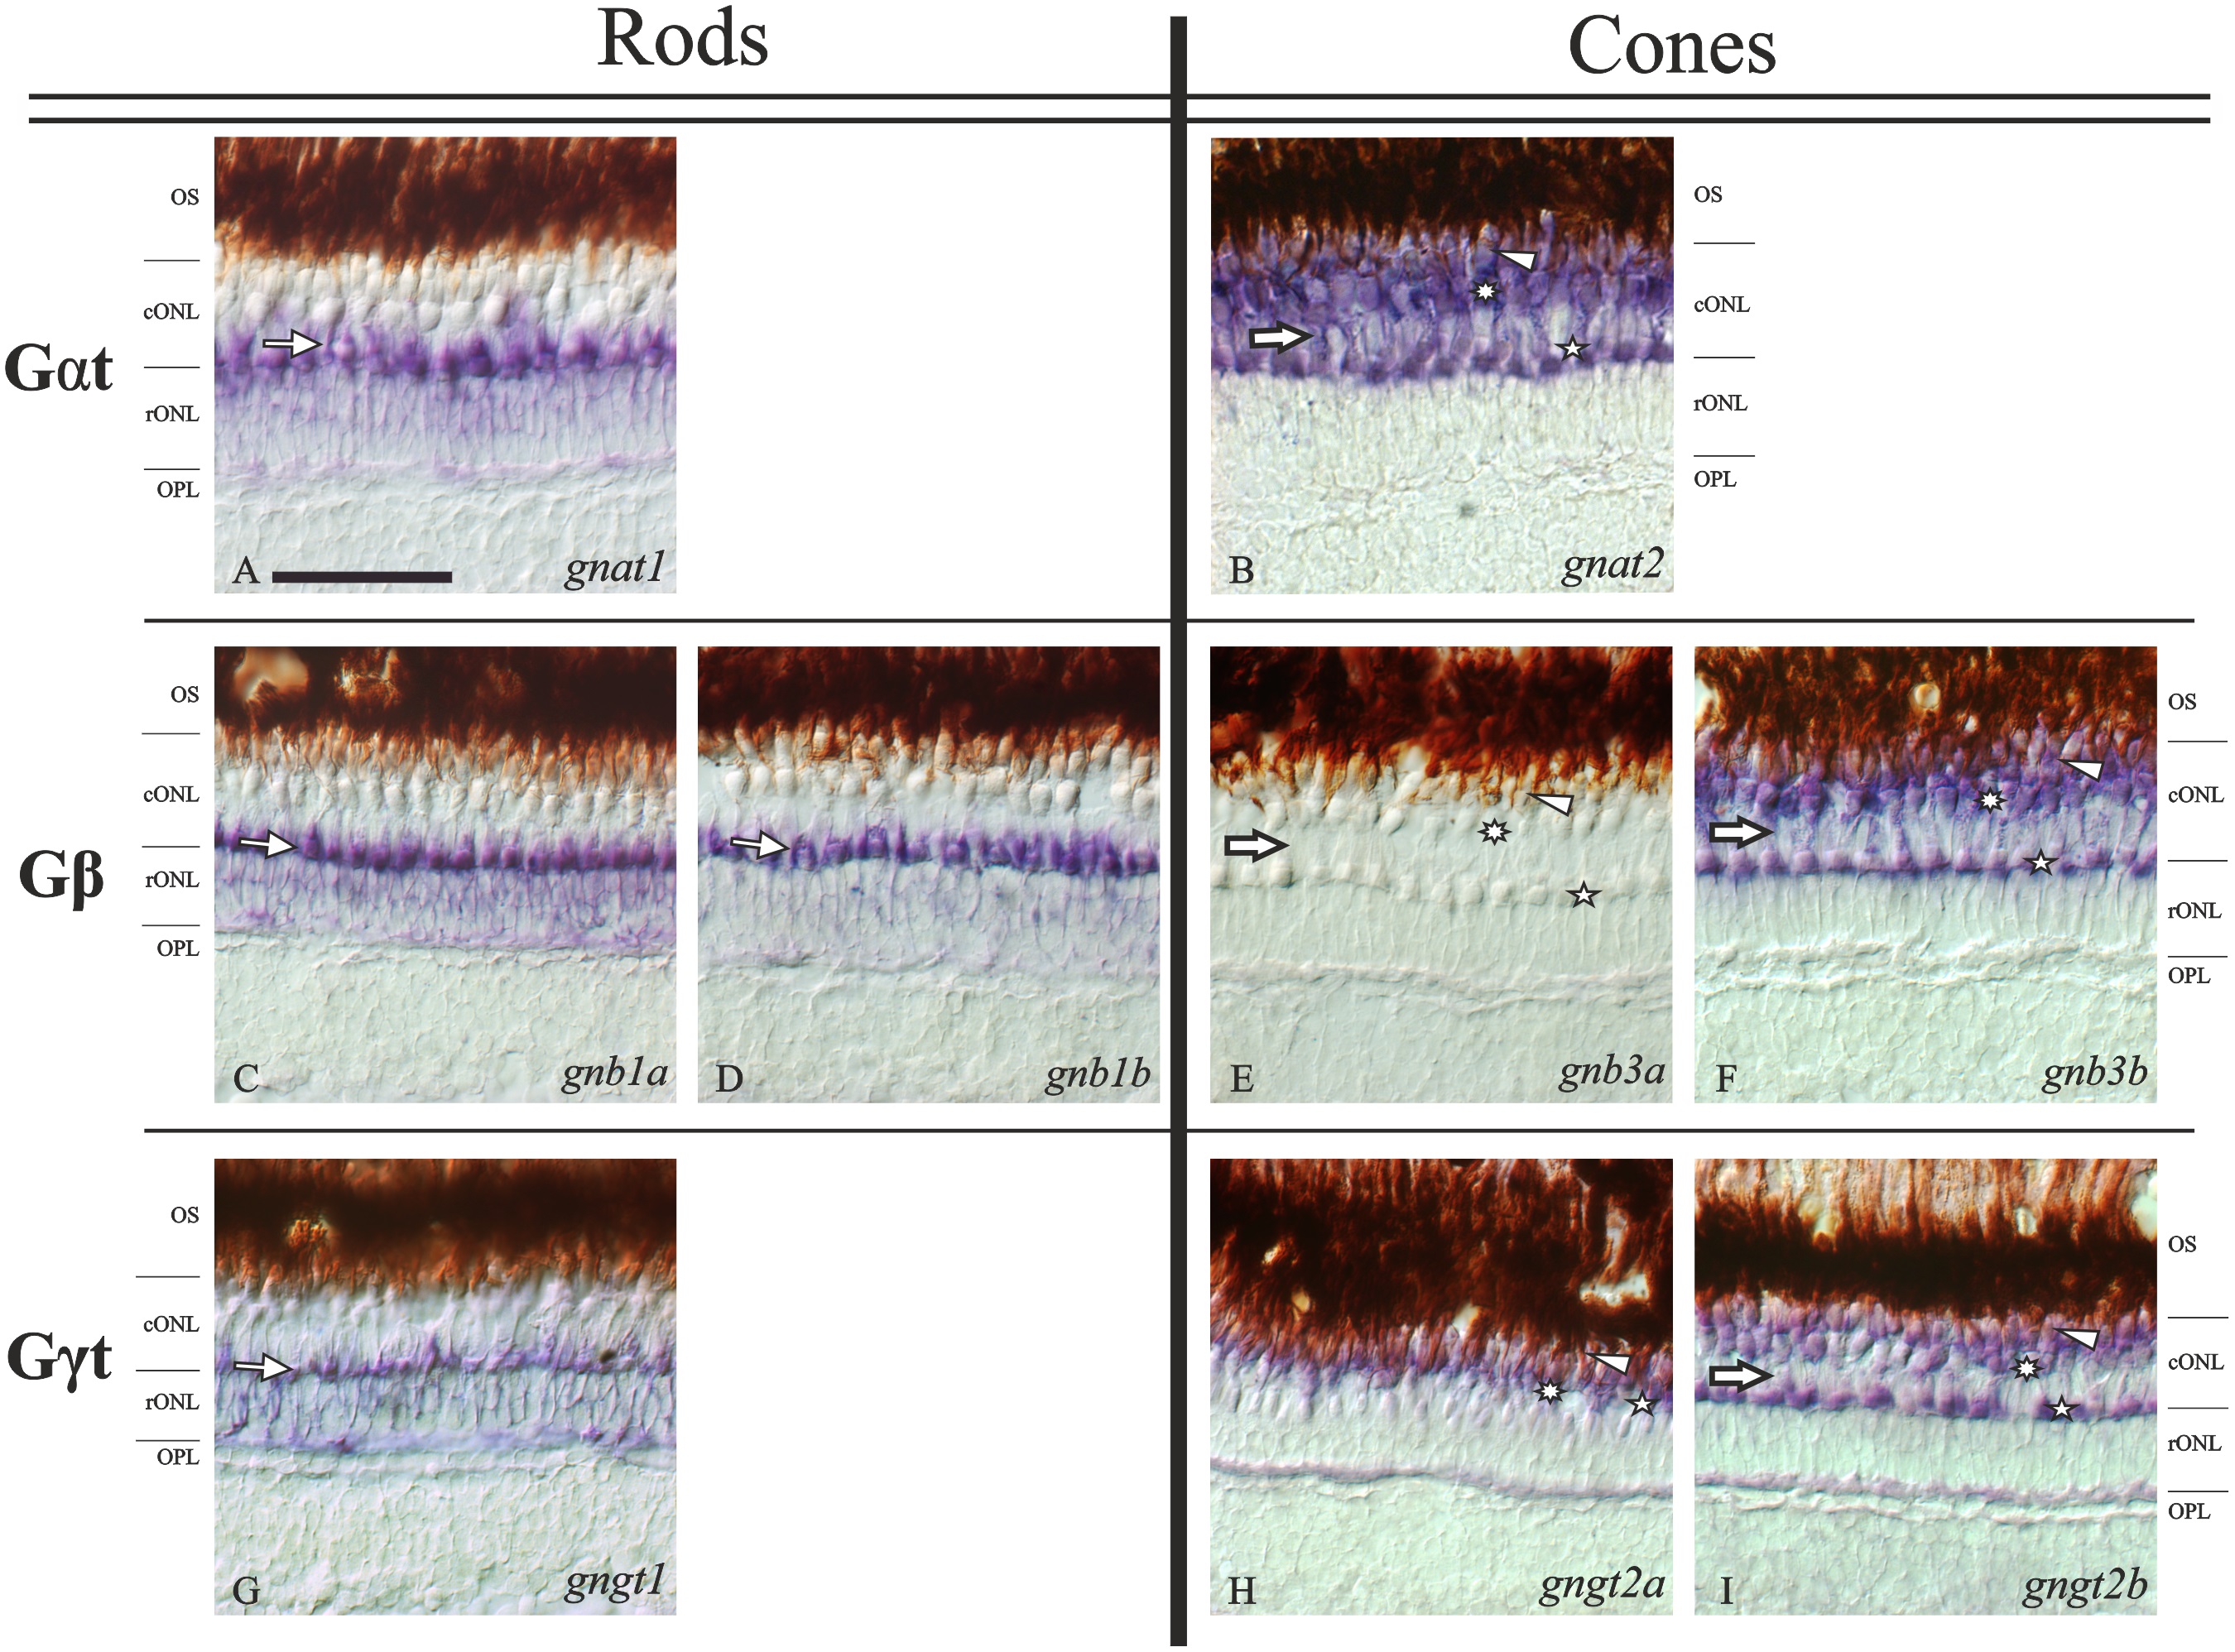
Nomarski contrast photomicrographs from radial sections of adult zebrafish retina showing the expression of all the transducin mRNAs. Panels A, C, D and G show the rod-specific expression of gnat1, gnb1a, gnb1b and gngt1, respectively. Their expression is observed in the rod nuclei of the rONL, but the strongest staining is observed in their myoids, which are embedded in the cONL sublayer (thin arrows). Panels B, F, H and I show the expression of gnat2, gnb3b, gngt2a and gngt2b, respectively, in all cones: DC (arrowheads), LSC (asterisks) and SSC (stars). The brown retinal pigment epithelium is shown the uppermost part for each picture. The stratification of the outer retina is evident in all panels except H, due to the exclusive ventral expression of gngt2a, where the stratification becomes unclear. Panel E shows the lack of staining in the adult retina for the gnb3a gene. Note that the weaker stained band into the ONLc for the cone-specific transducin subunits (thick arrows) corresponds to the rods’ myoid position (thin arrows in rods photomicrographs). Scale bar in panel A: 50 µm. For abbreviations see Fig. 2 legend.