
Fig. 3
|
Fig. 3
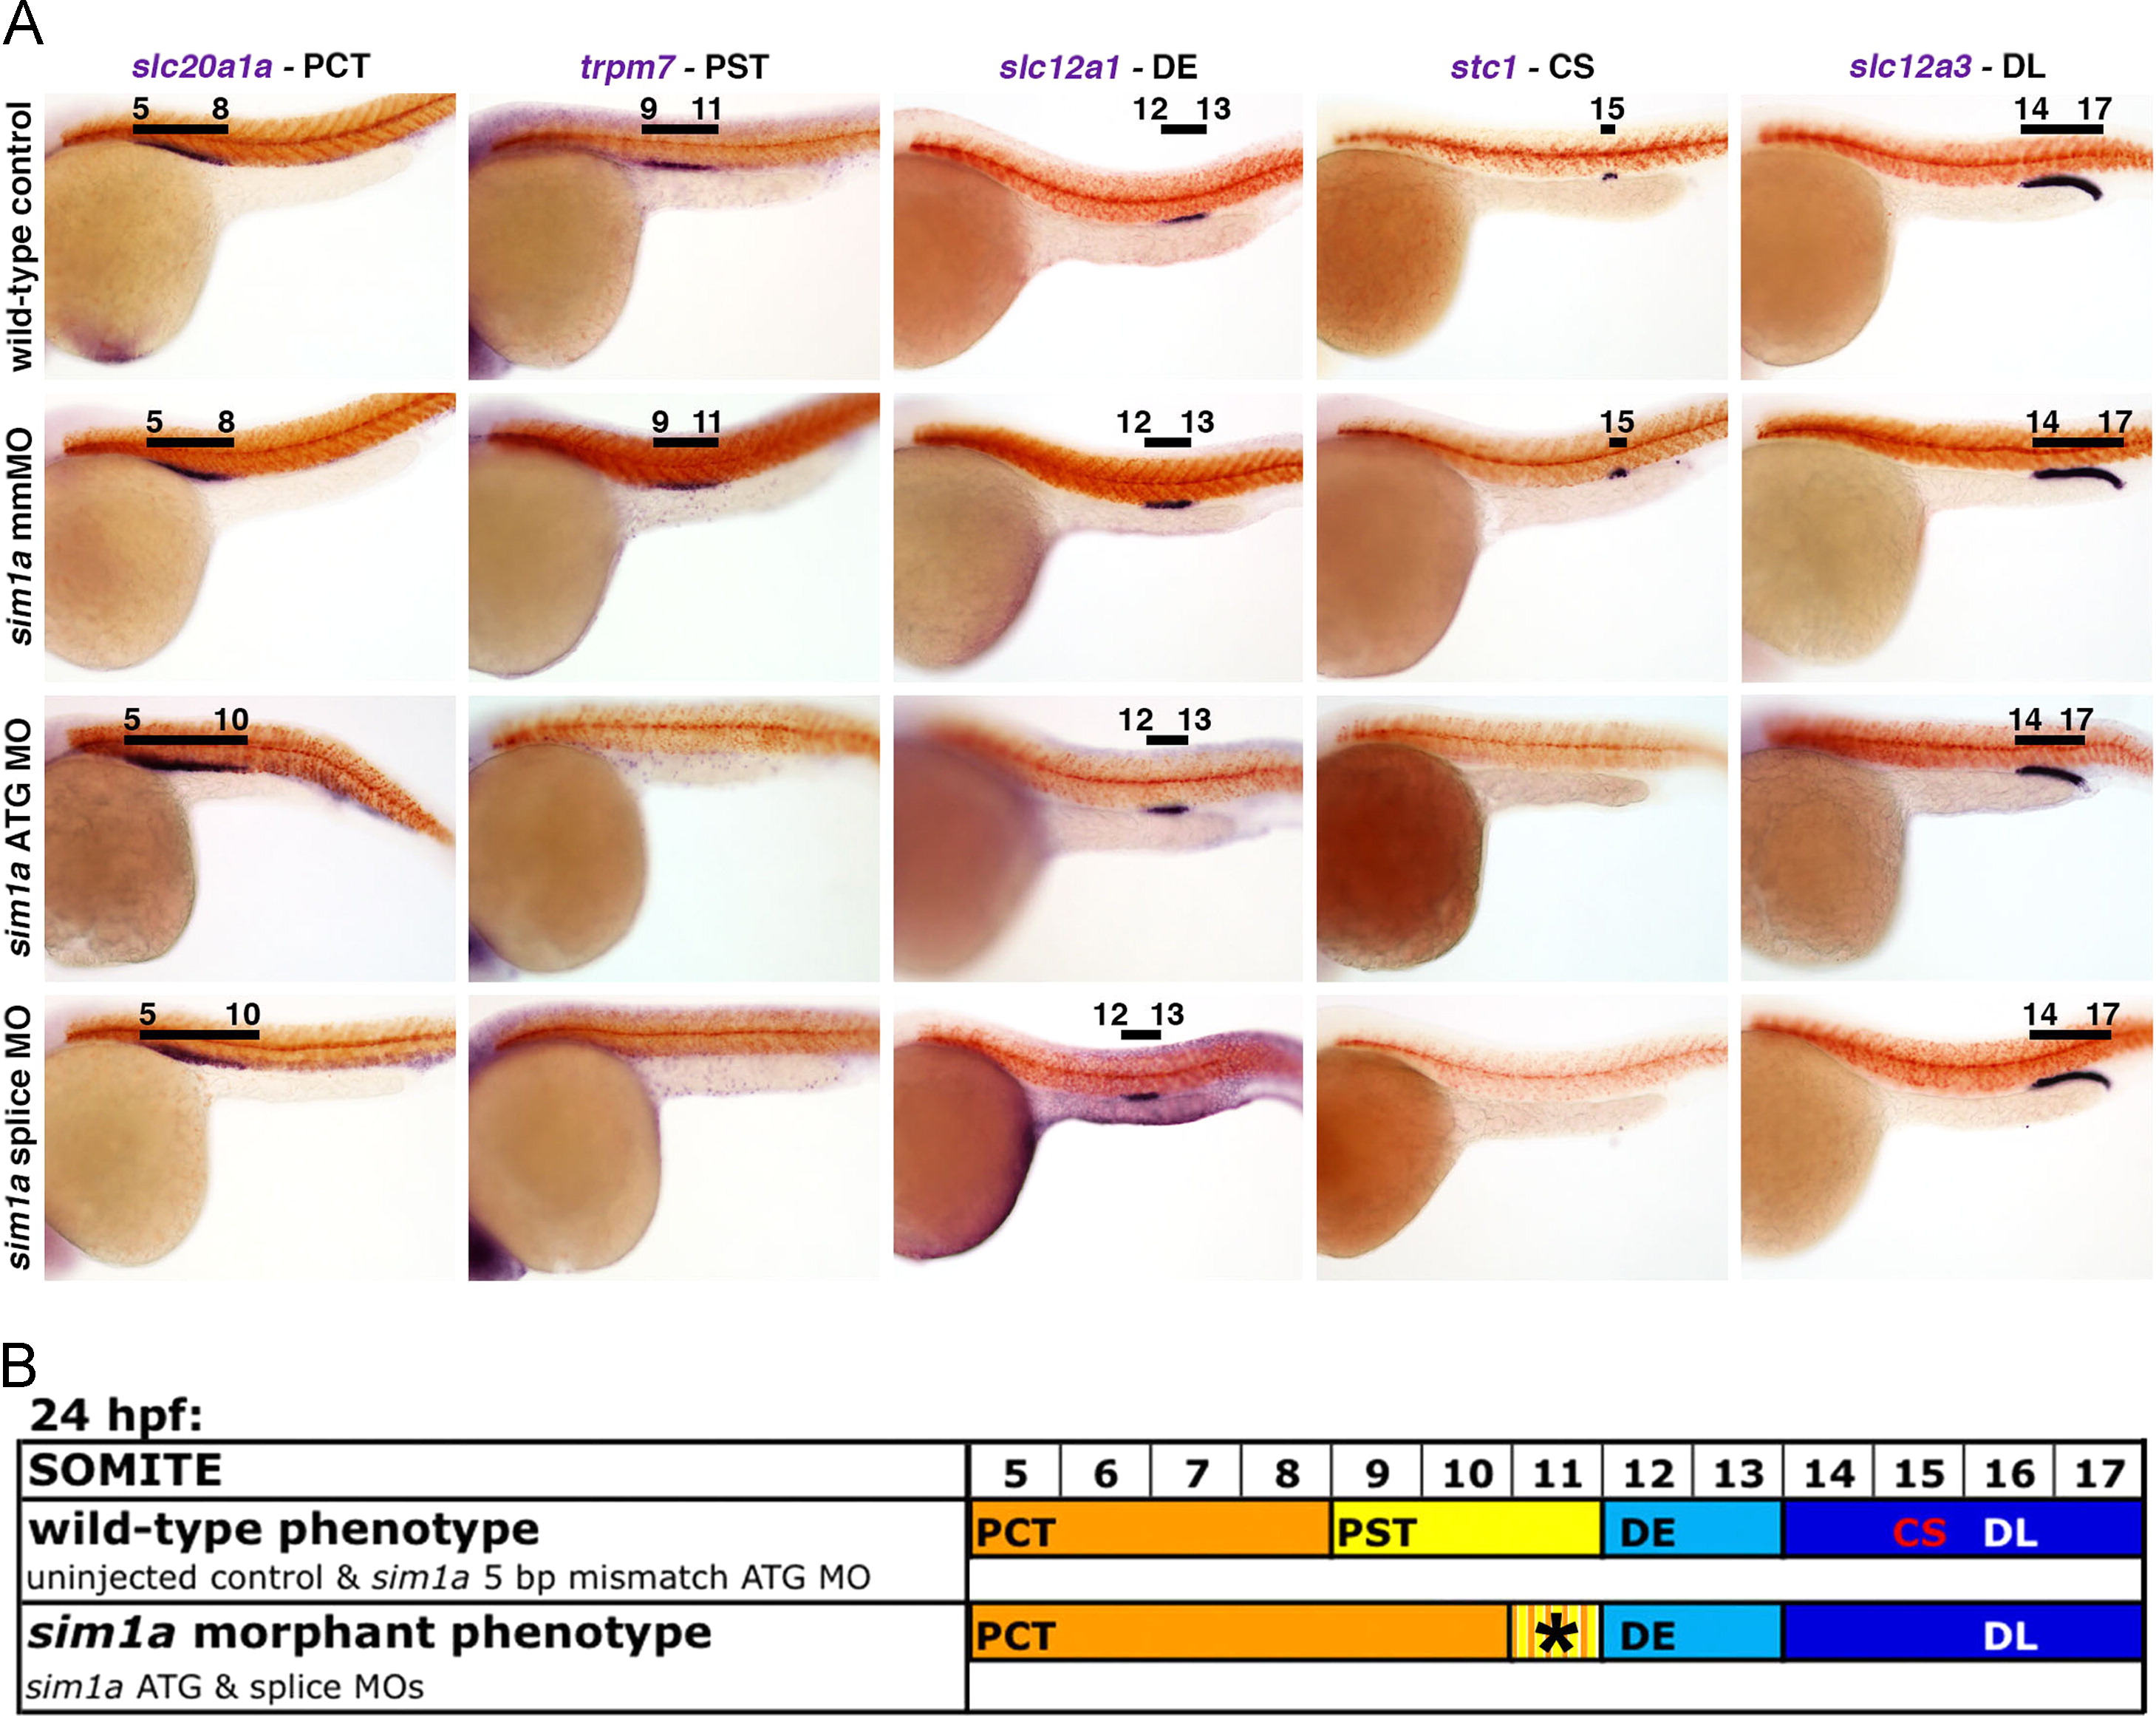
The loss of sim1a results in the abrogation of the PST segment and the CS. (A) Segmentation patterning changes within the pronephros following sim1a knockdown were independently assessed by the utilization of MOs targeting the sim1a ATG and splice sites. Control 5 bp ATG mmMO injections were performed to further confirm the specificity of the sim1a translation-targeting MO. WISH of embryos at 24 hpf indicates the expression of specific kidney segment markers (purple) in relation to the somites, which were labeled with smyhc1 (red). Segment domains are further demarcated by black lines with corresponding somite numbers as indicated. Embryo anterior is to the left. (B) Diagram indicates the dominant segmentation phenotypes displayed by sim1a morphants in comparison to the wild-type controls at 24 hpf. Colored bars indicate the respective domains of each nephron segment in relation to the somite numbers located above. The striped regions within the colored bars signify areas with lower transcript expression. Abbreviations: CS – corpuscles of Stannius; DE – distal early; DL – distal late; hpf – hours post fertilization; mmMO – mismatch morpholino; MO – morpholino; PCT – proximal convoluted tubule; PST – proximal straight tubule; WISH – whole mount in situ hybridization.
Reprinted from Developmental Biology, 399(1), Cheng, C.N., Wingert, R.A., Nephron proximal tubule patterning and corpuscles of Stannius formation are regulated by the sim1a transcription factor and retinoic acid in zebrafish, 100-16, Copyright (2015) with permission from Elsevier. Full text @ Dev. Biol.