
|
Fig. 2
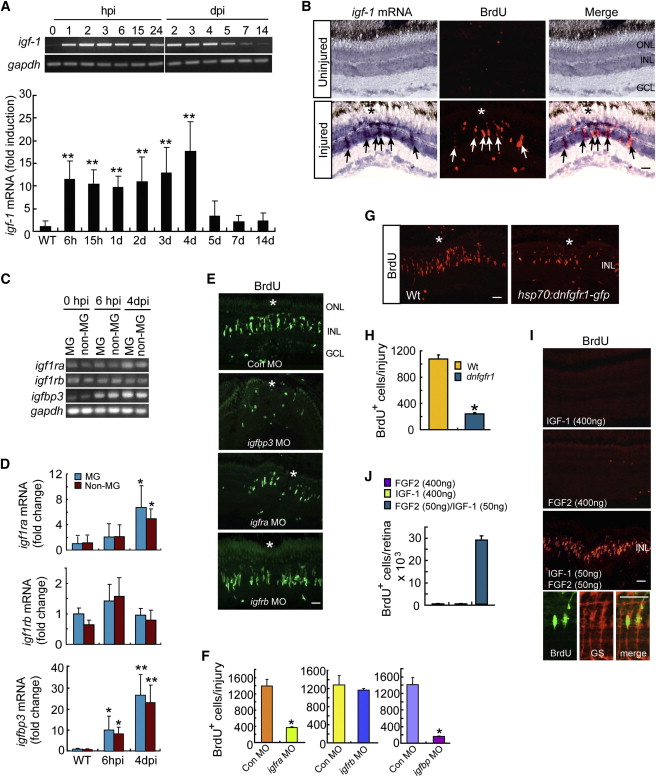
IGF-1 and FGF2 Synergize with Each Other to Stimulate MG Proliferation in the Uninjured Retina
(A) RT-PCR and qPCR analysis of injury-dependent induction of igf-1 mRNA. Error bars represent SD; p < 0.001; n = 6.
(B) In situ hybridization shows injury-dependent induction of igf-1 RNA in BrdU+ progenitors (arrows) at 4 dpi. Scale bar represents 50 µm. Asterisk marks the injury site.
(C and D) RT-PCR (C) and qPCR (D) analysis of igf1ra, igf1rb and igfbp3 gene expression in FACS purified MG and non-MG at different times post retinal injury. Error bars (D) represent SD; p < 0.05, p < 0.01; n = 4.
(E) BrdU immunofluorescence shows effect of morpholino (MO)-mediated knockdown of Igfbp3, Igfra, or Igfbp on progenitor formation in the injured retina. Scale bar represents 50 µm. Asterisk marks the injury site.
(F) Quantification of BrdU+ cells in (E). Error bars represent SD; p < 0.05; n = 3.
(G) BrdU immunofluorescence shows that conditional overexpression of dnFgfr1 in hsp70:dnfgfr1-egfp fish suppresses the generation of BrdU+ progenitors at 4 dpi. Asterisk marks the injury site. Scale bar represents 50 µm.
(H) Quantification of BrdU+ cells in (G). Error bars represent SD; p < 0.05 n = 3.
(I) BrdU immunofluorescence shows IGF-1 and FGF2 synergize to stimulate MG proliferation in the uninjured retina. Scale bar represents 50 µm. Bottom three panels show that BrdU+ cells are also GS+ MG.
(J) Quantification of BrdU+ cells in I. Error bars represent SD; n = 3.
See also Figure S2.