
|
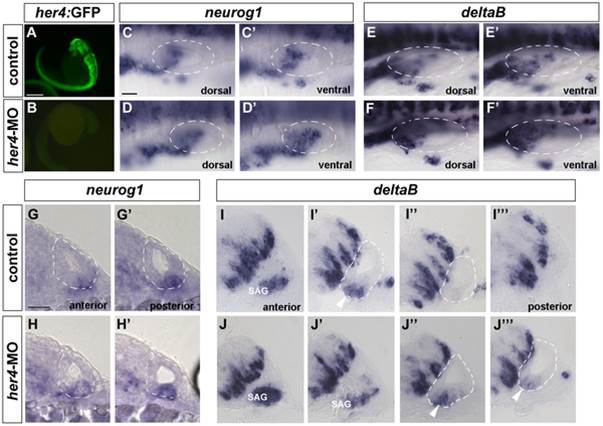
Fig. 5 Increased density of neurog1 and deltaB-positive cells in the neurogenic domain after her4 blockade.
(A, B) GFP expression in Tg(her4:GFP) line. In her4-MO injected embryos GFP expression is completely lost (B) compared to controls (A). (C–D′) Dorsal views of 24 hpf control (C, C′) and her4-MO injected (D, D′) embryos stained by in situ hybridization for neurog1. (D, D′) neurog1 expression in her4 morphant embryos is increased in the ventral plane (D′) compared to controls (C′). (E–F′) Dorsal views of 27 hpf control (E, E′) and her4-MO injected (F, F′) embryos stained by in situ hybridization for deltaB. (F, F′) deltaB expression in her4 morphant embryos is increased in the dorsal and ventral plane (F, F′) compared to controls (E, E′). (G–H′) Sequential transversal sections; medial to the left, dorsal to the top of 24 hpf control (G, G′) and her4-MO injected (H, H′) embryos stained by in situ hybridization for neurog1. In morphant embryos an increased number of cells in the otic epithelium stained for neurog1 is observed compared to controls. (I–J′′′) Sequential transversal sections; medial to the left, dorsal to the top of 27 hpf control (I–I′′′) and her4-MO injected (J, J′′′) embryos stained by in situ hybridization for deltaB. In morphant embryos the number of deltaB-positive cells in the otic epithelium (compare J′′ with I′) is increased and also the size of the SAG (J, J′). In control embryos SAG is only present in one section (I). Arrowheads point to epithelial neuroblasts. Dashed circles delineate otic vesicles. Scale bar in A and B: 500 µm, Scale bar in C-F′: 25 µm, Scale bar G-J′′′: 25 µm.