
Fig. 8
|
Fig. 8
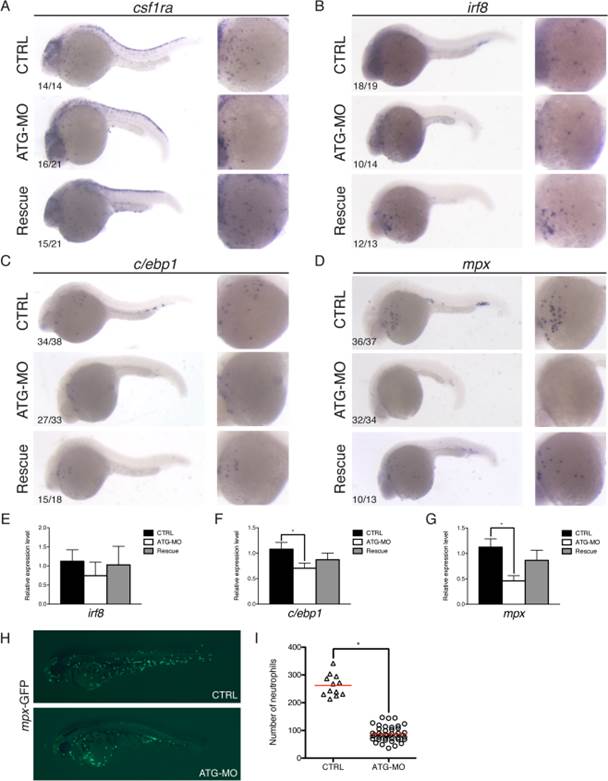
smoc2 morphants display defects in embryonic myelopoiesis at the onset of blood circulation. A–D: Lateral views of the embryos, anterior to the left, dorsal to the top, at the onset of circulation. A: WISH analysis or the macrophage markers csf1ra (A) and irf8 (B), and the neutrophil markers c/ebp1 (C) and mpx (D). E–G: qPCR analysis for irf8 (E), c/ebp1 (F) and mpx (G). Values plotted as mean ± SEM; n = 4; *P < 0.05. H,I: Visualization of the mpx-positive cells using the mpx reporter embryos (Tg(mpx:GFP)i114) at 3 dpf (H) and the quantification of the number of neutrophils in the ATG morphants (n = 42) as compared to the control embryos (n = 12; *P < 0.05) (I).