
|
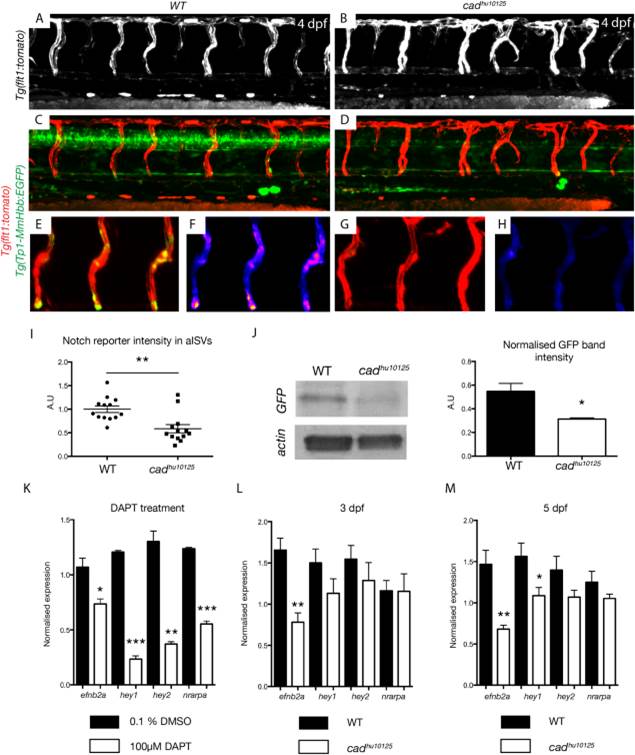
Fig. 4 Notch signaling is reduced in cadhu10125 mutants. A–D: The vasculature Tg(flt1:tomato, Tp1-MmHbb:EGFP) in wild-type siblings (n = 43) and cadhu10125 (n = 12) embryos at 4 dpf, (A,B), Tg(flt1:tomato); (C,D), Tg(Tp1-MmHbb:EGFP; flt1:tomato). E–H Computer assisted segregation of vascular specific expression of (Tp1-MmHbb:EGFP) in Tg(flt1:tomato, Tp1-MmHbb:EGFP) wild-type siblings (n = 13 embryos, 40 aISVs analysed) and cadhu10125 (n = 13 embryos, 38 aISVs analysed) at 4 dpf. E,G: aISVs, Tg(flt1:tomato, Tp1-MmHbb:EGFP) positive, in wild-type siblings (E) and cadhu10125 embryos (G) at 4 dpf. F,H: aISVs-restricted expression of Tg(Tp1-MmHbb:EGFP) in wild-type siblings (F) and cadhu10125 embryos (H) at 4 dpf. Fluorescence intensity is displayed as a heat map, with a low to high color-coded from blue to white. I: Quantification of aISV-restricted Notch-reporter intensity based on analysis displayed in (F) and (H) (P = 0.0012). Each point represents the average aISV signal intensity in individual WT sibling embryos (n = 13 embryos, 40 aISVs analysed) or cadhu10125 embryos (n = 13 embryos, 38 aISVs analysed) normalised to average WT sibling signal intensity. J: Western blot detection of GFP expression in 48 hpf pooled embryos from WT and cadhu10125 Notch reporter transgenic embryos. The level of GFP expression is significantly reduced in cadhu10125 embryos (P = 0.0274). The expression of actin was used to monitor protein input and normalise GFP band intensity. K: Quantitative RT-PCR for the Notch target genes efnb2a, hey1, hey2, and nrarpa in embryos treated with 0.1% DMSO (black columns) or 100 µM DAPT (white columns), shows that the expression of these genes is significantly reduced when Notch signaling is inhibited from 24 hpf to 3dpf) (3 biological replicates, e10 embryos each). L,M: Quantitative RT-PCR for the Notch target genes efnb2a, hey1, hey2 and nrarpa in WT (black columns) and cadhu10125 (white columns) embryos at 3 dpf (WT, n = 5; cadhu10125, n = 5 biological replicates, e10 embryos each)(L) and 5 dpf (WT, n = 5; cadhu10125, n = 4 biological replicates, e10 embryos each) (M). efnb2a reduction at 3 dpf, P = 0.0017, 5 dpf P = 0.0082.; hey1 reduction at 5 dpf, P = 0.0437. Other trends nonsignificant in cadhu10125 mutants but significant in DAPT treated embryos.