
|
Fig. 3
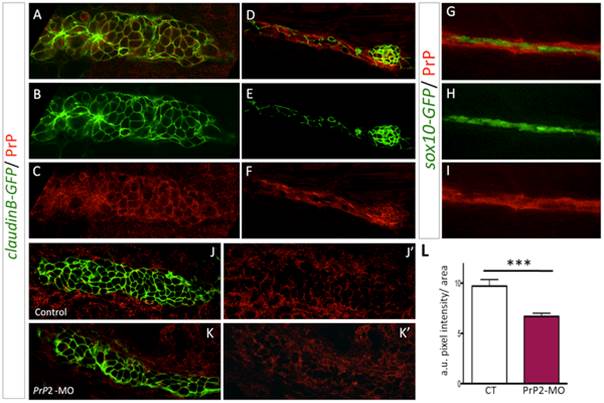
PrP2 is expressed in the primordium.
A–C. Immunofluorescence on 30 hpf claudinB-GFP embryos using anti-PrPC antibodies, revealed PrP expression at the membrane of primordium cells during the migration process. D–F. Neuromast cells as well as interneuromastic cells are positive for PrP2. What is represented by the arrows here? G–I. PrP immunofluorescence on 48 hpf sox10-GFP embryos, showed that Schwann cells are included in PrP expression area. J, J2. Expression level of PrP2 within the primordium in control embryos. K, K2. Expression level of PrP2 within the primordium in Prp2-MO. L. Quantification analysis using pixel intensity measurement with ImageJ software, within the primordium areas, reveals a significant decrease of PrP2 expression level in Prp2-MO. a.u.: arbitrary unit of pixel intensity, area: primordium anlage (*** p<0.001, Mann-Whitney test, n = 10).