
|
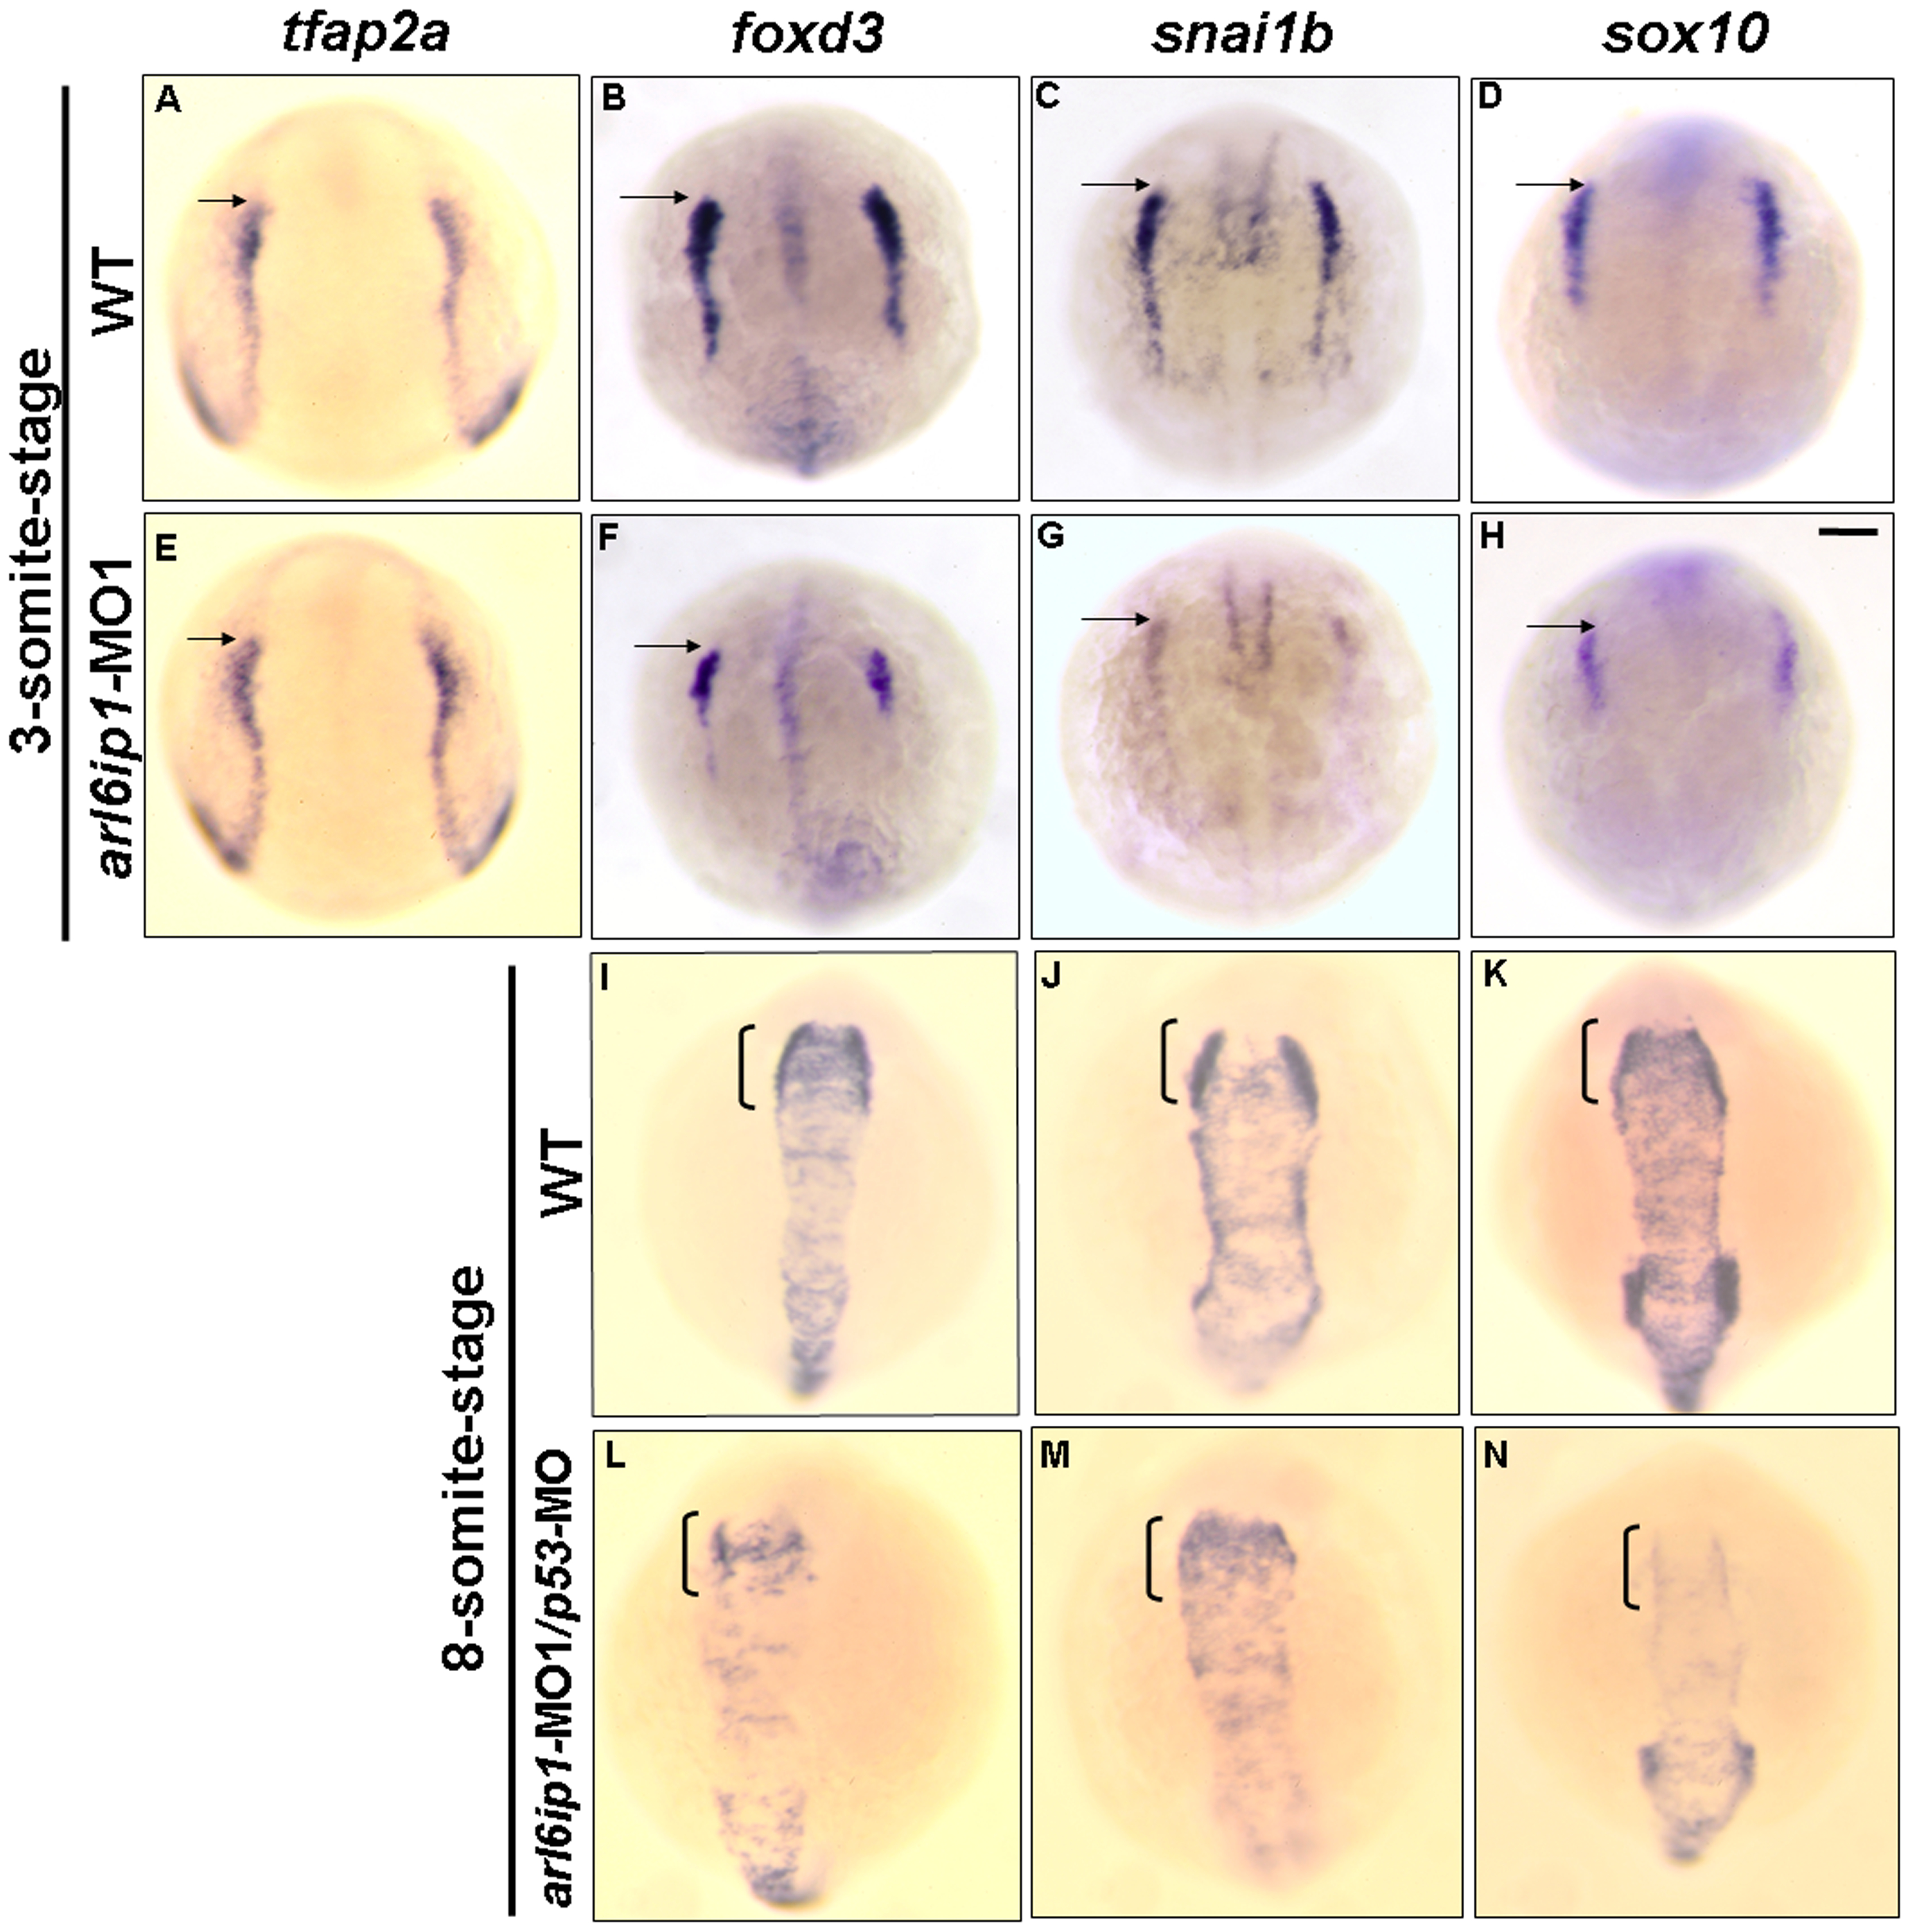
Fig. 5 The markers of pre-migratory neural crest cells are down-regulated in arl6ip1-MO1-injected embryos.
Dorsal views of 3-somite-stage wild-type (A, B, C, D) and arl6ip1 knockdown embryos (E, F, G, H), or 8-somite-stage wild-type (I, J, K,) and arl6ip1 knockdown embryos (L, M, N) were shown to reveal the indicated markers. Neural plate border was indicated with the expression of tfap2α (A, E), foxd3 (B, F), snai1b (C, G) and sox10 (D, H). Decreased expression of these markers, except tfap2α, was evident and predominant in arl6ip1 morphants. Arrows indicate position of midbrain-hindbrain boundary. (I-K) At the 8-somite stage, these markers were expressed predominantly in early migrating cranial neural crest cells (indicated by brackets). (L-N) These genes were reduced in embryos co-injected with 4 ng arl6ip1-MO1/6 ng p53-MO, especially in foxd3 and snai1b expression.