
|
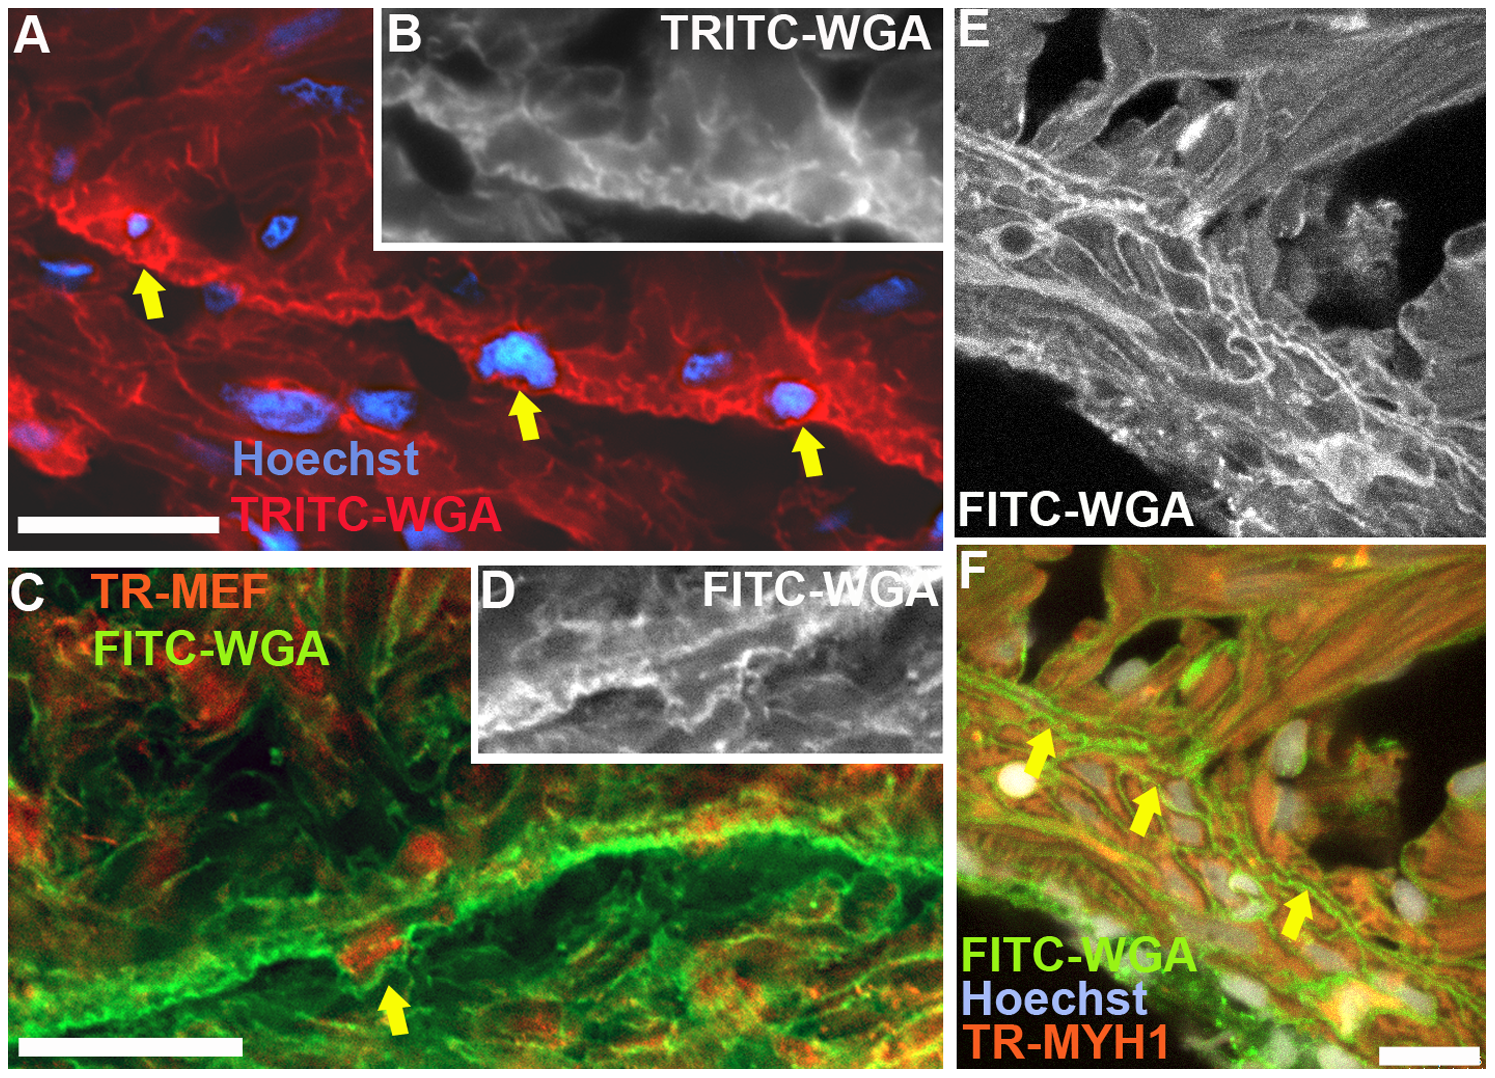
Fig. 3
Immunofluorescence imaging of the zebrafish ventricle junctional region.
(A), staining with TRITC-labeled wheat germ agglutinin (WGA) highlighting cardiac myocytes borders, in conjunction with Hoechst staining, to illustrate the transitional cardiac myocytes (arrows). (B), original monochrome image of the TRITC-WGA stained cell borders containing the two right-most nuclei identified by the arrows in panel A. (C), immunostaining with MEF antibody to label myocyte nuclei and FITC-labeled WGA-stained cell membranes; the arrow identifies a transitional cardiac myocyte. (D), original monochrome image of the FITC-WGA stained cell membranes in panel C around the nucleus identified by the arrow. (E), confocal image of FITC-WGA-stained cardiac myocyte membranes. (F), overlay images of FITC-WGA in panel E with MYH1 (anti-myosin heavy chain-1 antibody) immunostaining, and Hoechst staining identifying transitional cardiac myocytes (arrows). Scale bar, 10 μm.