
|
Fig. 6
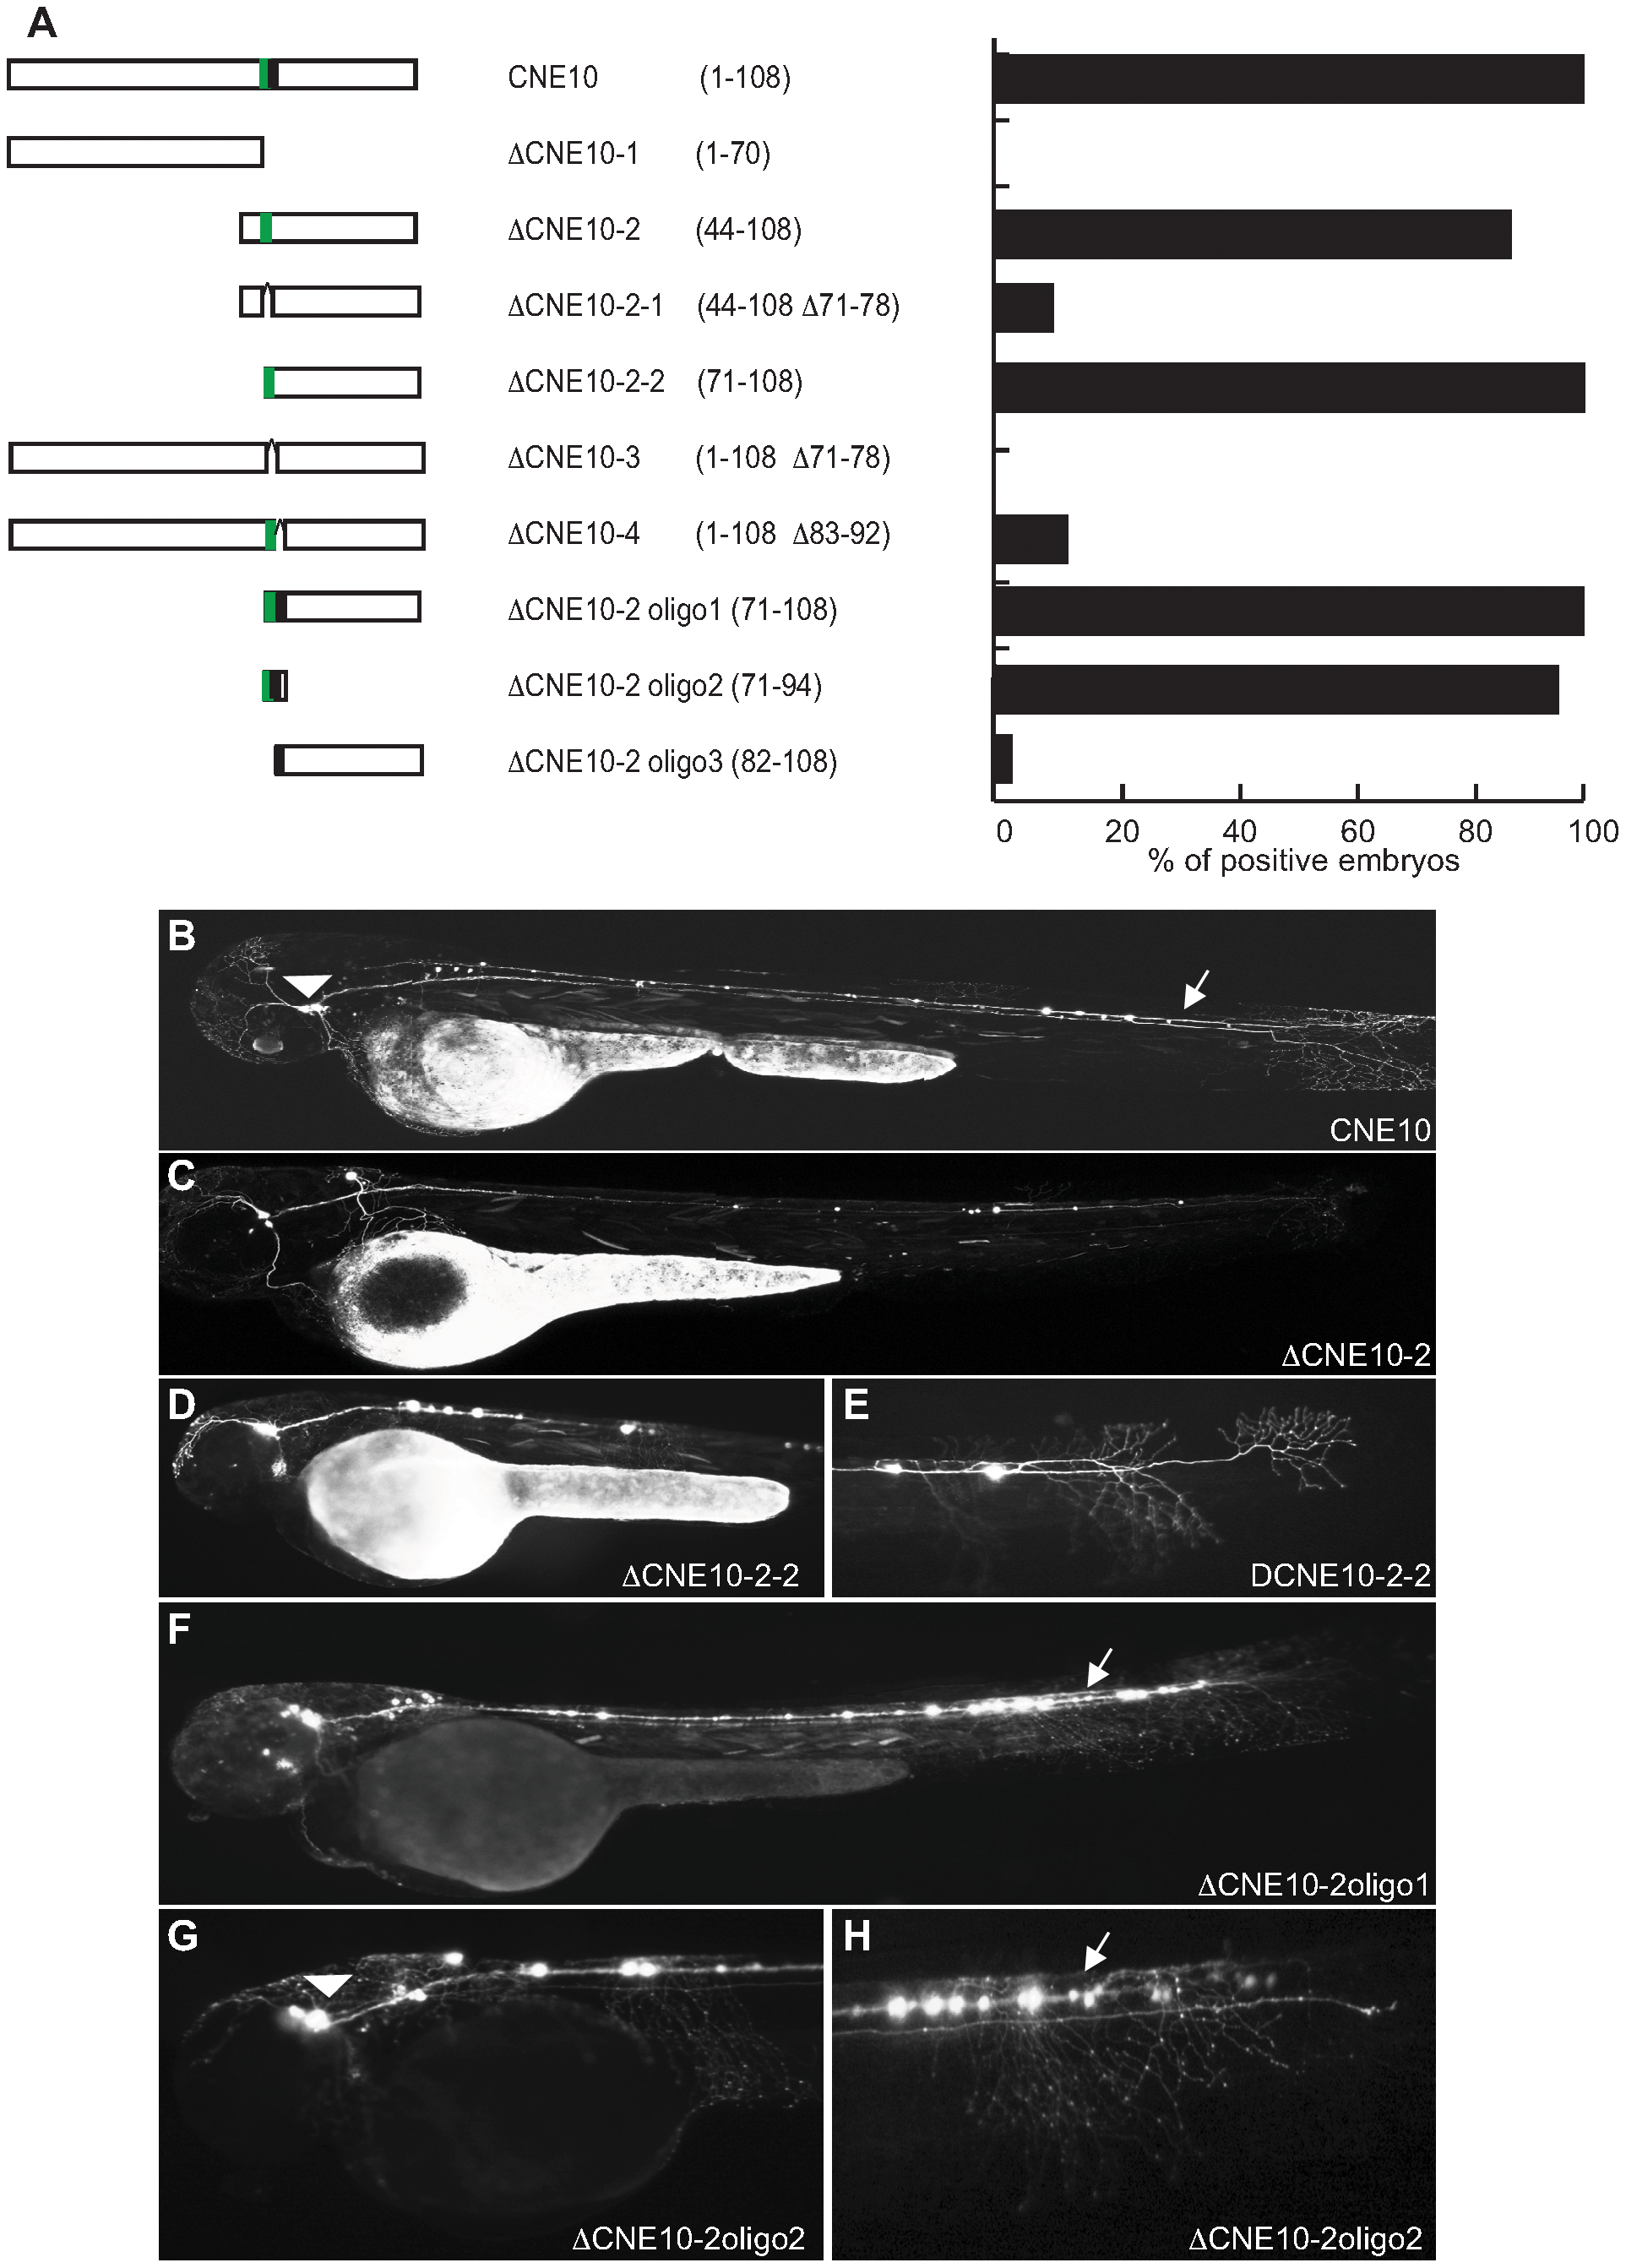
Deletion analysis of Meis_ciCNE10 construct.
(A) Schematic view and quantification of the constructs injected in the embryos and analyzed at 48 hpf. The numbers in parentheses indicate the size of each construct. The green area represents a putative Pbx-Hox site (nt71–79) and the black area a random 10 bp sequence (nt 83–92). (B) View of an embryo injected with the full length CNE10 showing GFP expression in the trigeminal ganglion (arrowhead) and spinal cord sensory neurons (arrow). The two elements DCNE10-2 (C) and DCNE10-2-2 (D, E) retain the same enhancer potential as the full length construct (B). Embryo injected with the 37 bp DCNE10-2oligo1 (F) or with the 24 bp DCNE10-2oligo2 (G, H) show strong GFP expression in sensory neurons (arrow) and trigeminal ganglia (arrowhead).