
|
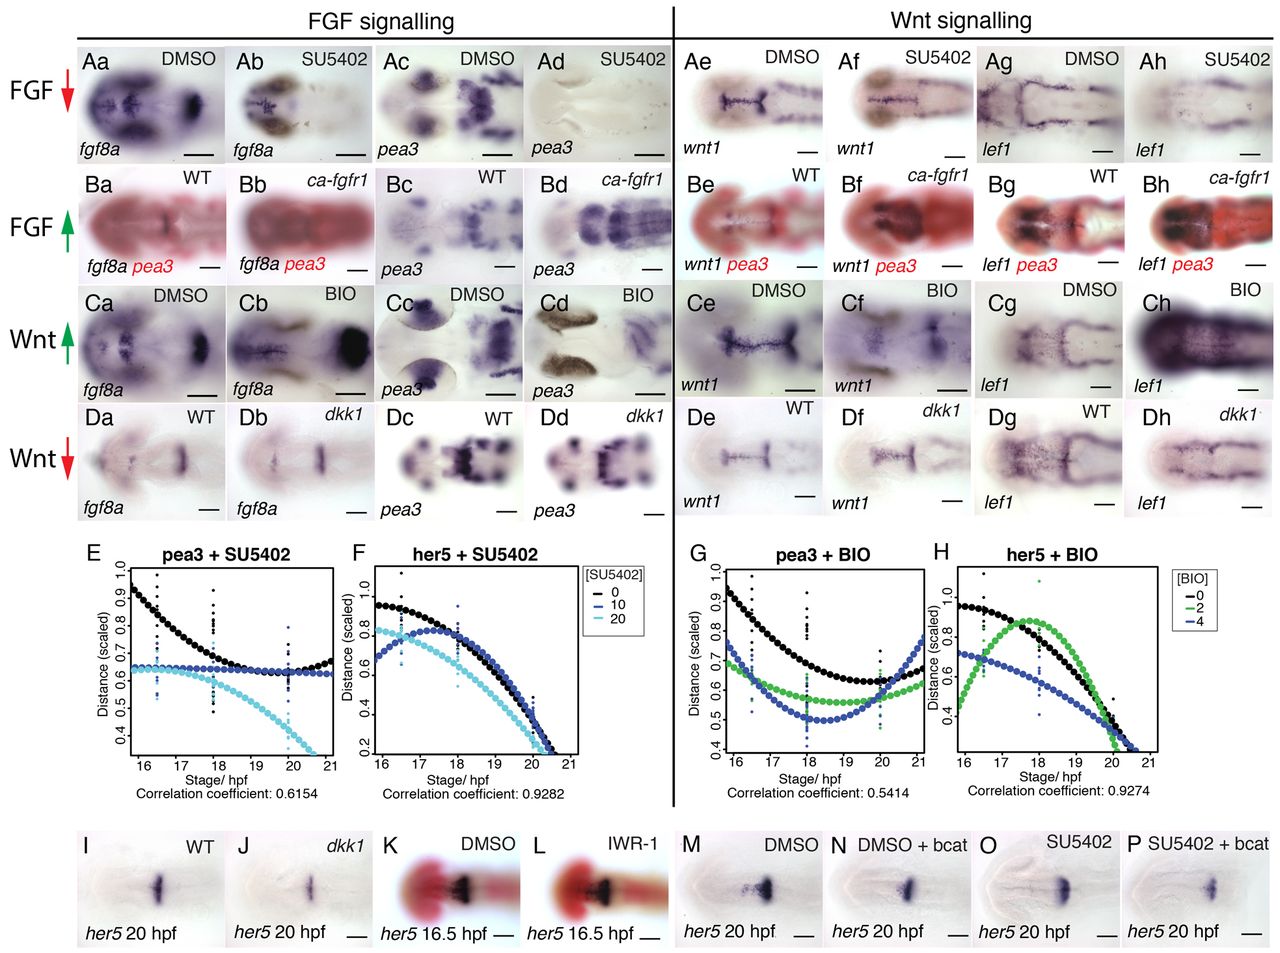
Fig. 4
FGF and Wnt signalling interact to regulate each other’s activity. Dorsal views of zebrafish embryos processed for in situ hybridisation with probes to fgf8a (a,b in A-D), pea3 (c,d in A-D), wnt1 (e,f in A-D) and lef1 (g,h in A-D) following treatment with 40 μM SU5402 (Aa-h) or 4 μM BIO (Ca-h) or DMSO from 14 hpf or in transgenic Tg[hsp70:dkk1b-egfp] (Da-h), Tg[hsp70:ca-fgfr1] (Ba-h) and non-transgenic siblings after heat shock induction at 16.5 hpf. Spatial expression of pea3 (E,G) and her5 (F,H) across the dorsal midbrain was measured at 16.5, 18 and 20 hpf (n=10 for each stage) following exposure to SU5402 (E,F; 0, 10, 20 μM) or BIO (G,H; 0, 3, 6 μM). Polynomial plots (dotted line) were generated from quadratic equations describing the expression of each gene over time under the various conditions. Dorsal views of embryos processed by in situ hybridisation with probes to her5 (I-P) and pax6 (red, K,L) following treatment with 10 μM SU5402 (O,P), 40 μM IWR-1 (L) or DMSO from 14 hpf (K,M,N) in wild type (K,L), transgenic Tg[hsp70:dkk1b-egfp] (J) and non-transgenic siblings (I) or Tg[UAS:HA-bcat]; Tg[hsp70:gal4] (N,P) and non-transgenic siblings (M,O) after heat-shock induction at 16.5 hpf. Scale bars: 100 μm.