
|
Fig. 1
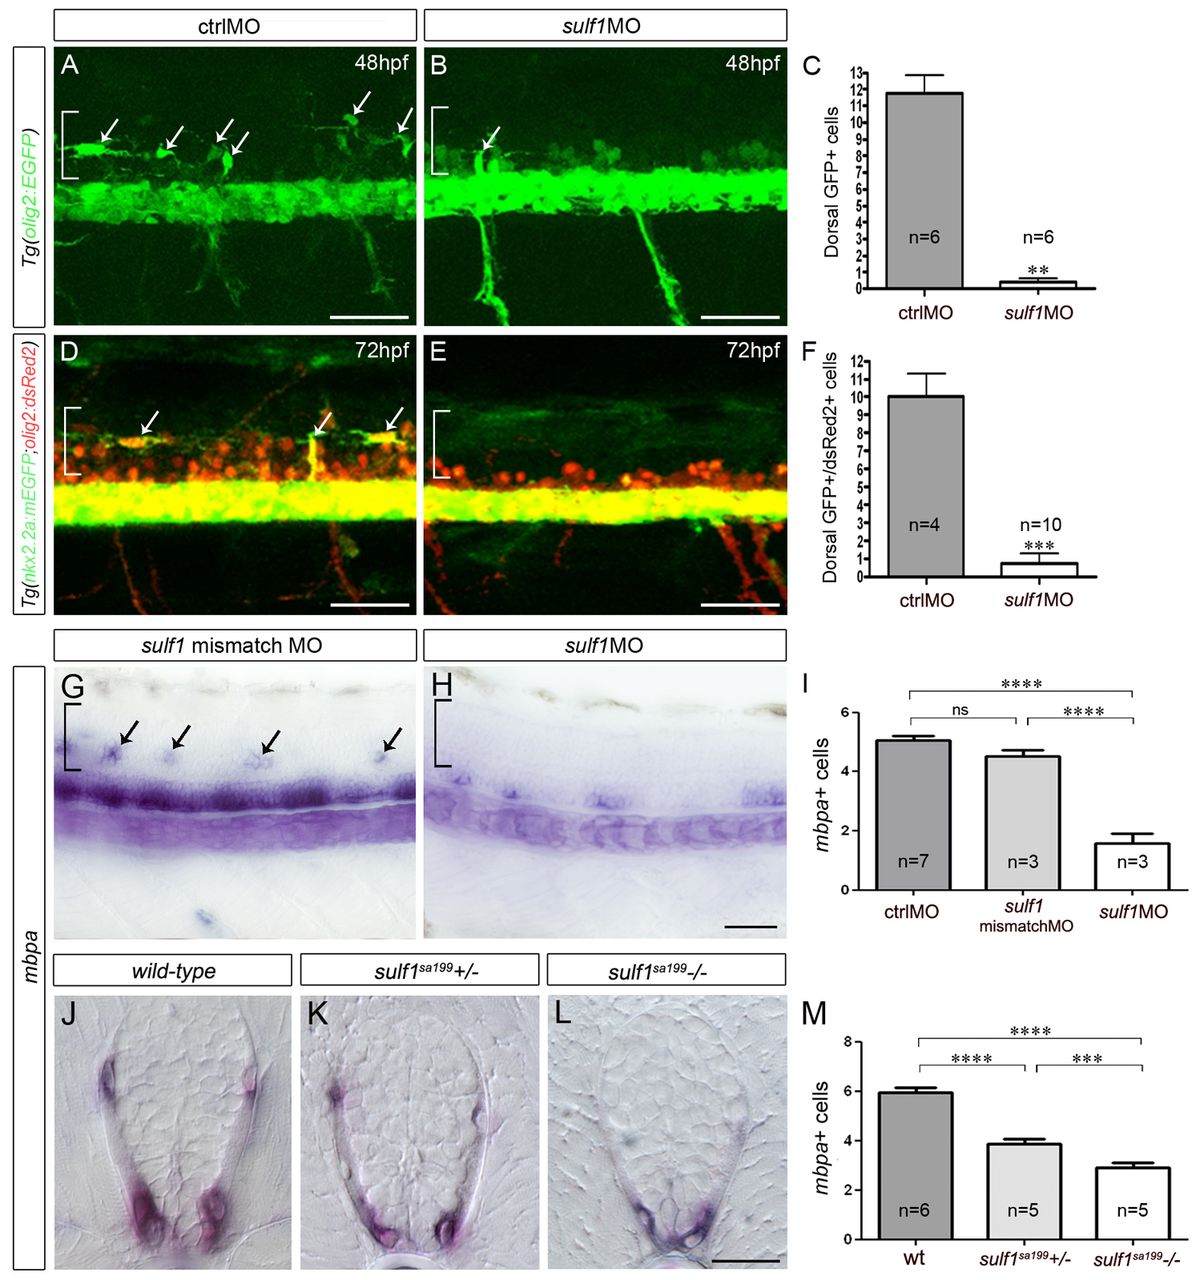
Sulf1 depletion impairs OPC development in zebrafish. A-H show side views of whole embryos at the level of the trunk spinal cord; anterior to the left and dorsal to the top. J-L show transverse spinal cord sections, dorsal to the top. (A-C) Detection (A,B) and quantification (C) of dorsal OPCs (arrows) at 48 hpf in Tg(olig2:GFP) embryos injected with ctrlMO (A) and sulf1MO (B). (D-F) Detection (D,E) and quantification (F) of dorsal OPCs (arrows) at 72 hpf in Tg(nkx2.2a:mEGFP;olig2:dsRed2) larvae injected with ctrlMO (D) and sulf1MO (E). (G,H,J-L) Expression of mbpa at 72 hpf in larvae injected with sulf1 mismatch MO (G) and sulf1MO (H) and in wild-type (J), sulf1sa199+/- (K) and sulf1sa199-/- (L) larvae. (I,M) Quantification of mbpa+ cells in transverse sections of morphants (I) and sulf1sa199+/- incross progeny (M). Results are presented as mean number of cells ± s.e.m. (**P<0.01, ***P<0.001, ****P<0.0001; ns, non-significant). Brackets indicate position of the dorsal spinal cord. Scale bars: 100 μm (A-H), 50 μm (J-L).