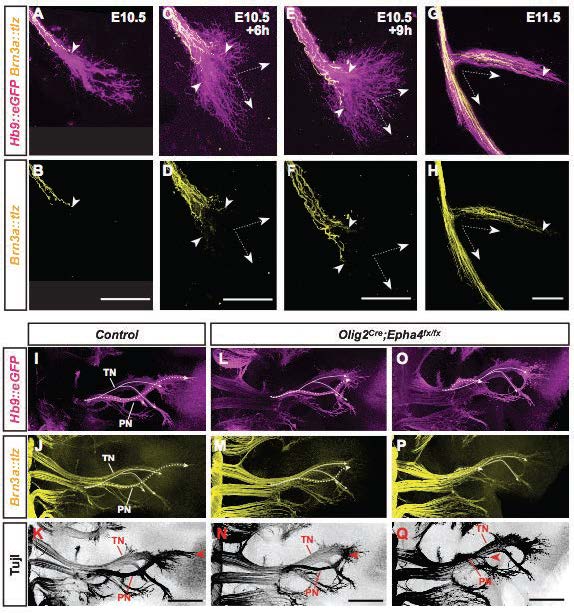
Fig. S4 Visualizing ME and SA extension and selectively manipulating ME extension in mouse hindlimb. (A-H) Sequential extension of MEs (magenta) and SAs (yellow) beyond the sciatic plexus during development. Arrowheads: forefront SA growth cones extending along pre-extending MEs. Arrows (C-H): routing of MEs and SAs along dorsal and ventral nerve sheets. (I-Q) Dorsal wholemount view of MEs (I,L,O), SAs (J,M,P) or all axons (K, N,Q) in control (I-K) and Olig2Cre;Epha4fx/fx mouse embryos (L-Q) at E12.5. Dotted lines trace peroneal (PN) and solid lines tibial (TN) nerves. (J-P) Relative severity of ventral misrouting of MEs in Olig2Cre;Epha4fx/fx hindlimb (L,O) is faithfully mirrored by reduced/lost dorsal SA extension (M,P), also apparent by corresponding reduction/loss of pan-axon label (N,Q). Scale bars: 100 µm in B,D,F,H; 300 µm in K,N,Q.
Image
Figure Caption
Acknowledgments
This image is the copyrighted work of the attributed author or publisher, and
ZFIN has permission only to display this image to its users.
Additional permissions should be obtained from the applicable author or publisher of the image.
Full text @ Development

