
|
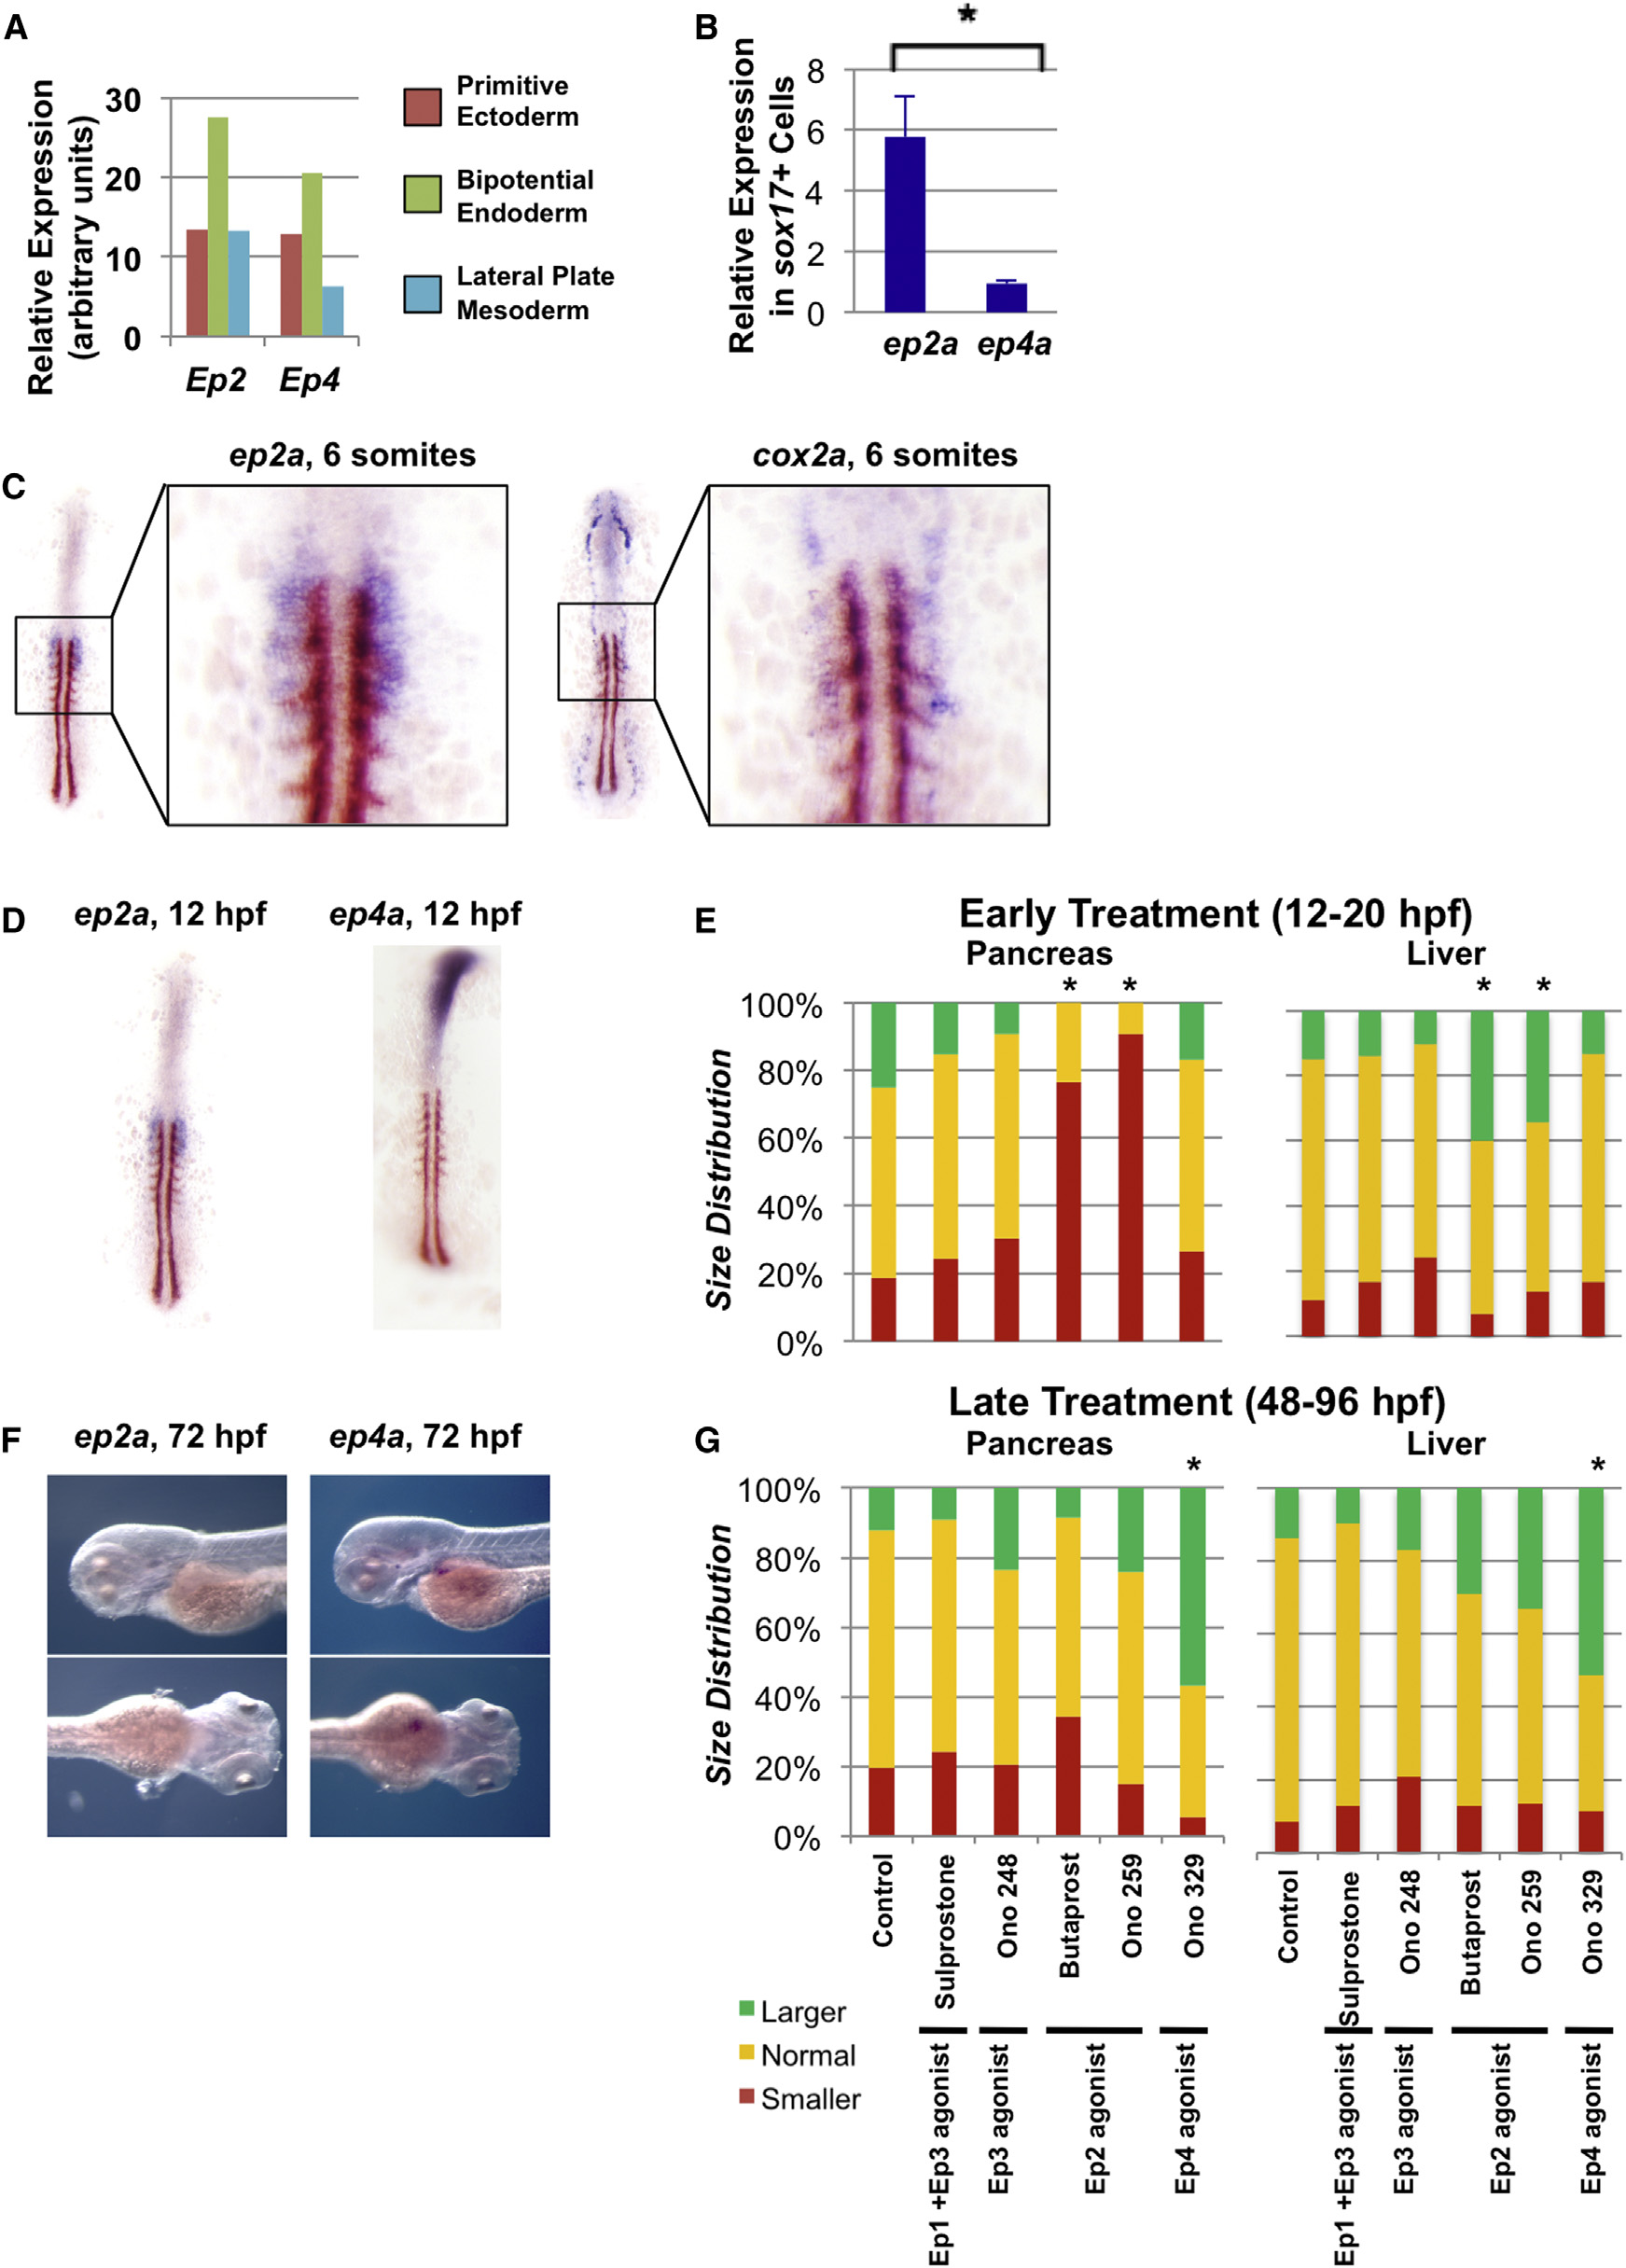
Fig. 5
Prostaglandin Pathway Genes Are Patterned to Regulate Endoderm Specification
(A) Microarray analysis reveals enrichment of Ep2 and Ep4 in bipotential endoderm progenitors compared to primitive ectoderm or lateral plate mesoderm derived from mouse embryonic stem cells, shown in arbitrary units.
(B) Quantitative PCR analysis of sox17+ endodermal cells sorted from sox17:GFP zebrafish embryos reveals enrichment of ep2a compared to ep4a. (Data represented as mean ± SEM; t test, p < 0.05; n = 3.)
(C) Double in situ hybridization for ep2a (purple) or cox2a (purple) and myod (brown) in zebrafish embryos at the six-somite stage.
(D) Double in situ hybridization for ep2a (purple) or ep4a (purple) and myod (brown) in zebrafish embryos at the six-somite stage.
(E) Size distribution of pancreas or liver progenitor domain following exposure to pharmacologic agonists or antagonists of various PGE2 receptors from 12 to 20 hpf. Impact on pancreas progenitors was assessed at 20 hpf by in situ hybridization to pdx1, and impact on liver progenitors was assessed at 28 hpf by in situ hybridization to hhex. The following pharmacologic agents were used: sulprostone (Ep1 + Ep3 agonist), Ono 248 (Ep3 agonist), butaprost (Ep2 agonist), Ono 259 (Ep2 agonist), and Ono 329 (Ep4 agonist). (Significant versus control by χ2 test, p < 0.05; n > 30 for each condition.)
(F) Expression of ep2a and ep4a at 72 hpf visualized by in situ hybridization. ep4a but not ep2a expression at 72 hpf corresponds to the emerging liver bud.
(G) Size distribution of pancreas or liver organs following exposure to pharmacologic agonists or antagonists of various PGE2 receptors from 48 to 96 hpf. Impact on pancreas outgrowth was assessed at 96 hpf by in situ hybridization to trypsin, whereas impact on liver outgrowth was assessed at 96 hpf by in situ hybridization to lfabp. (Significant versus control by χ2 test, p < 0.05; n > 30 for each condition.) See also Fig. S6.
Reprinted from Developmental Cell, 28(4), Nissim, S., Sherwood, R.I., Wucherpfennig, J., Saunders, D., Harris, J.M., Esain, V., Carroll, K.J., Frechette, G.M., Kim, A.J., Hwang, K.L., Cutting, C.C., Elledge, S., North, T.E., and Goessling, W., Prostaglandin E2 regulates liver versus pancreas cell-fate decisions and endodermal outgrowth, 423-437, Copyright (2014) with permission from Elsevier. Full text @ Dev. Cell