
|
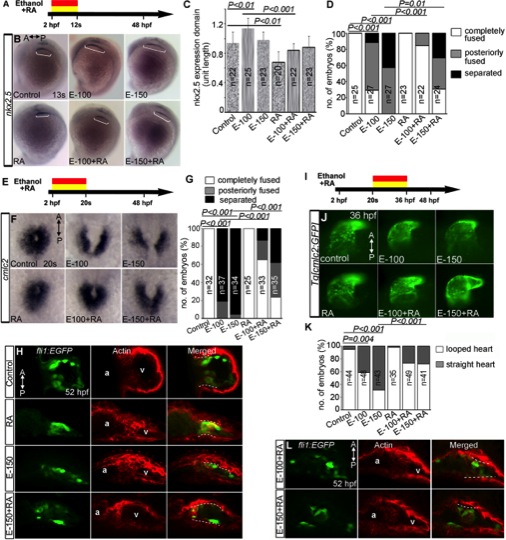
Fig. 7 RA supplementation during acute ethanol treatment partially rescues a subset of cardiac development defect. A, E, I: Schematic diagrams showing the timing of ethanol and RA exposure. B: ISH showed nkx2.5 expression (white brackets) in the control, ethanol, RA, and ethanol+RA treated embryos (2hpf–12s). C: Graph shows the quantification of nkx2.5 expressing domain length after ethanol exposure (2hpf–12s). D: Graph shows quantification of myocardial fusion at 20s after ethanol exposure (2hpf–12s). F: Expression of cmlc2 in the control, ethanol, RA, and ethanol+RA treated embryos (2hpf–20s). G: Graph shows the quantification of myocardial fusion. H: Stained Tg[fli1:EGFP] embryos showed the dispersion of GFP and F-actin-positive cells (white dashed line) throughout the ventricle in the ethanol and ethanol+RA cotreated embryos (2hpf–20s). J: Brightfield images of Tg[cmlc2:GFP] embryos showed hearts of control, ethanol, RA, and ethanol+RA treated (20s–36hpf) embryos. K: Graph showing the quantification of looped and straight heart (as in E-150) at 36 hpf (L) Stained Tg[fli1:EGFP] embryos showed reduced clustering of GFP, F-actin double positive cells near the AV boundary in ethanol+RA treated (20s–36 hpf) embryos (compare control panel 7H; ethanol 5E). Statistical analyses: C, Student′s t-tests; D, G, K, Mantel-Haenszel chi-square tests.