
Fig. 2
|
Fig. 2
Grk5l Governs LR Asymmetry Development
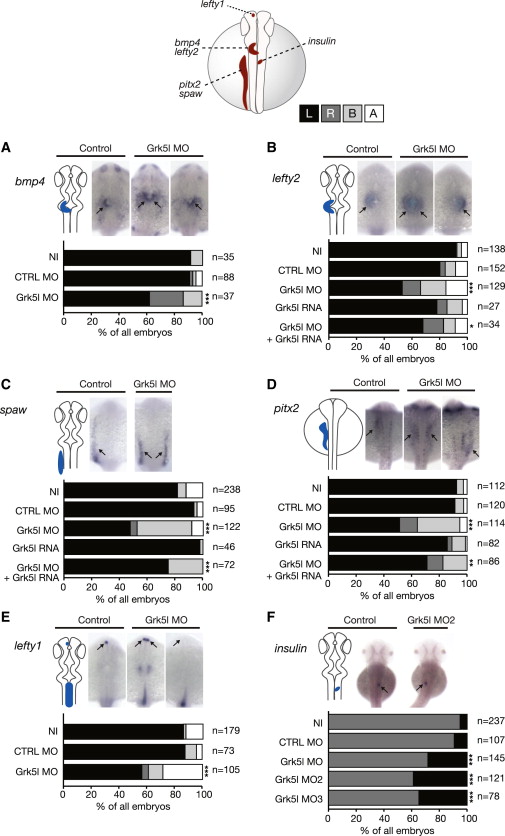
WMISH for leftward marker genes at 20–22 ss with the respective expression domain outlined next to the images. Bar graphs display percentages of expression on the left side (black), the right side (dark gray), and both sides of the midline (light gray), or no expression at all (white).
(A) bmp4 expression in the heart region is randomized upon Grk5l KD. CTRL MO versus Grk5l MO: p = 0.0056.
(B) Random distribution of lefty2 can be partially rescued by grk5l RNA. CTRL MO versus Grk5l MO: p < 0.0001; Grk5l MO versus Grk5l MO+grk5l RNA: p = 0.0425.
(C) spaw in the LPM is affected upon loss of Grk5l, but can be rescued by coinjection of grk5l mRNA. CTRL MO versus Grk5l MO: p < 0.0001; Grk5l MO versus Grk5l MO+grk5l RNA: p = 0.0002.
(D) Ambiguous pitx2 reversed by mRNA encoding for grk5l. CTRL MO versus Grk5l MO: p < 0.0001; Grk5l MO versus Grk5l MO+grk5l RNA: p = 0.0068.
(E) Lefty1 transcripts in the dorsal diencephalon are ambiguously distributed when Grk5l is lost. CTRL MO versus Grk5l MO: p < 0.0001.
(F) Loss of Grk5l interferes with pancreas placement, as can be seen by the expression of insulin. CTRL MO versus Grk5l MO: p = 0.0009; CTRL MO versus Grk5l MO2: p < 0.0001; CTRL MO versus Grk5l MO3: p < 0.0001.