
|
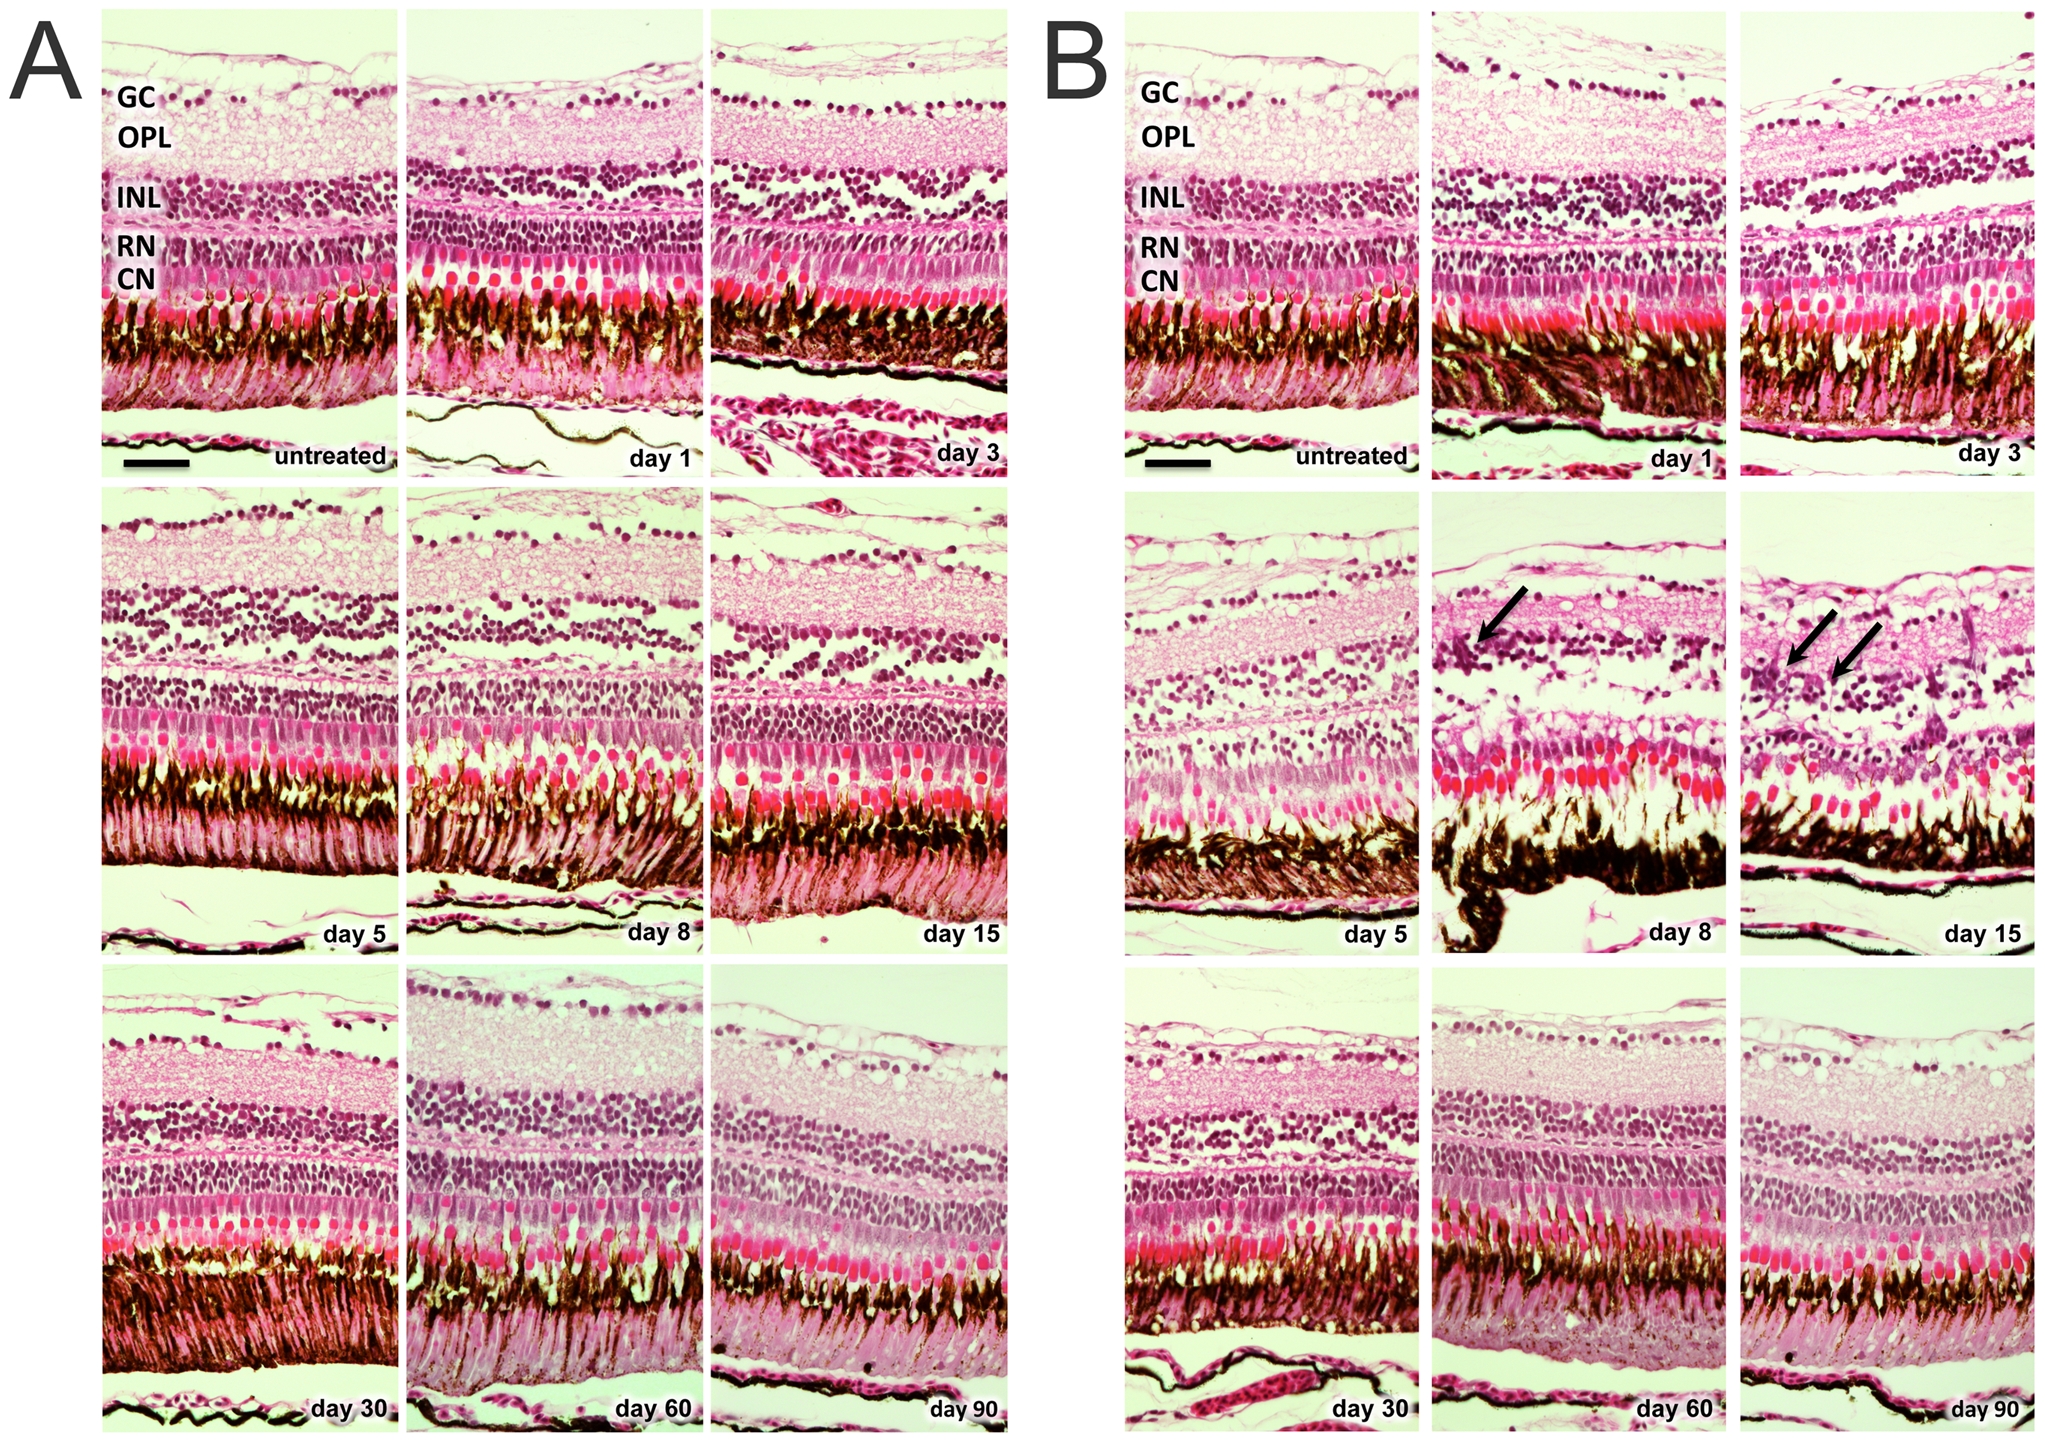
Fig. 1
H&E staining of zebrafish retinas at baseline and after MNU exposure.
A. MNU 50 mg/l group: only minor changes of retinal structure were observed after MNU treatment (e.g., disruption of the inner nuclear layer and vacuolation of the outer nuclear layer between day 1 and 30). B. MNU 150 mg/l group: Histological changes already started at day 1 (e.g., disruption of the inner nuclear layer and vacuolation of the outer nuclear layer), resulting in massive retinal degeneration with loss of nearly all rod cells at day 8. On days 8 and 15, accumulations of cell clusters (arrows) were found mainly in the inner nuclear layer. GC (ganglion cells), OPL (outer plexiform layer), INL (inner nuclear layer), RN (rod nuclei), CN (cone nuclei). Scale bar indicates 25 μm.