
|
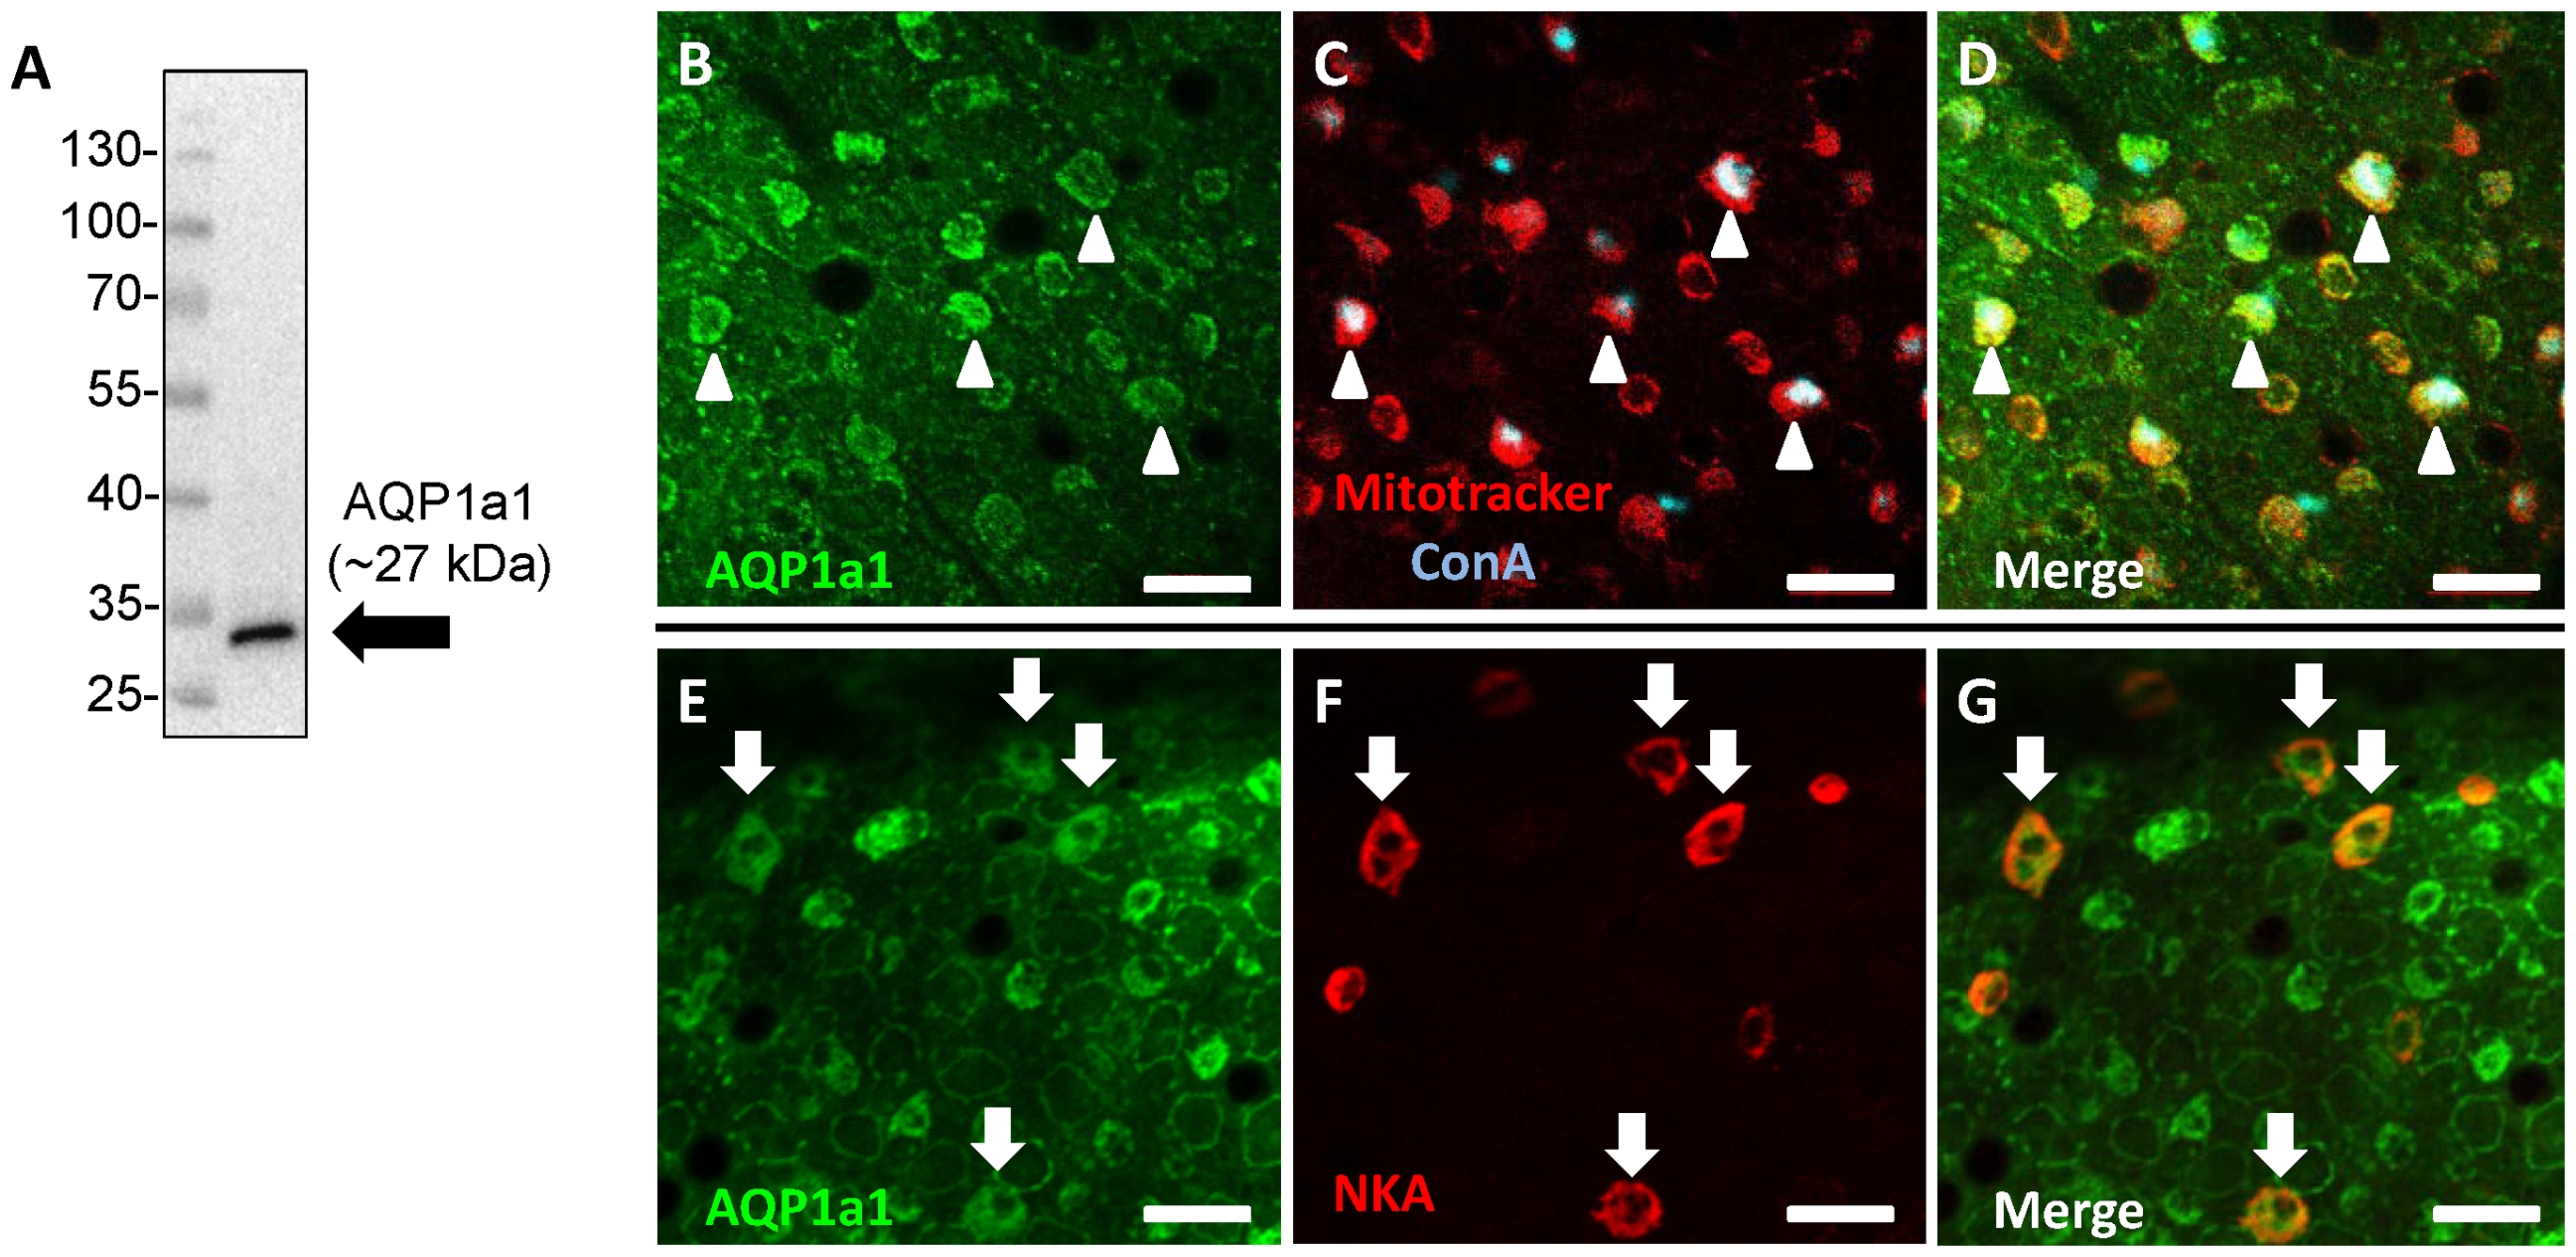
Fig. 3
Aquaporin-1a1 is expressed in ionocytes on the skin of yolk sac in larval zebrafish.
(A) A representative western blot showing that the eel aquaporin-1a1 (AQP1a1) antibody yielded a single immunoreactive band at ~27 kDa in lysates of 4 dpf zebrafish larvae. (B) Fluorescent immunohistochemistry and confocal microscopy revealed that the expression of AQP1a1 on the skin of yolk sac (green), and a subset of cells stained positively with Mitotracker® (red) and concanavalin-A (conA; blue). (D) is the merged images of B and C. Cells labelled with arrowheads represent areas of colocalization of AQP1a1 and Mitotracker® or conA. (E) Some AQP1a1-positive cells (green) were also colocalized with (F) Na+/K+-ATPase staining (NKA; red). (G) is the merged images of E and F. Cells labelled with arrows represent areas of colocalization of AQP1a1 and NKA. Scale bar = 25 μm.