
|
Fig. 1
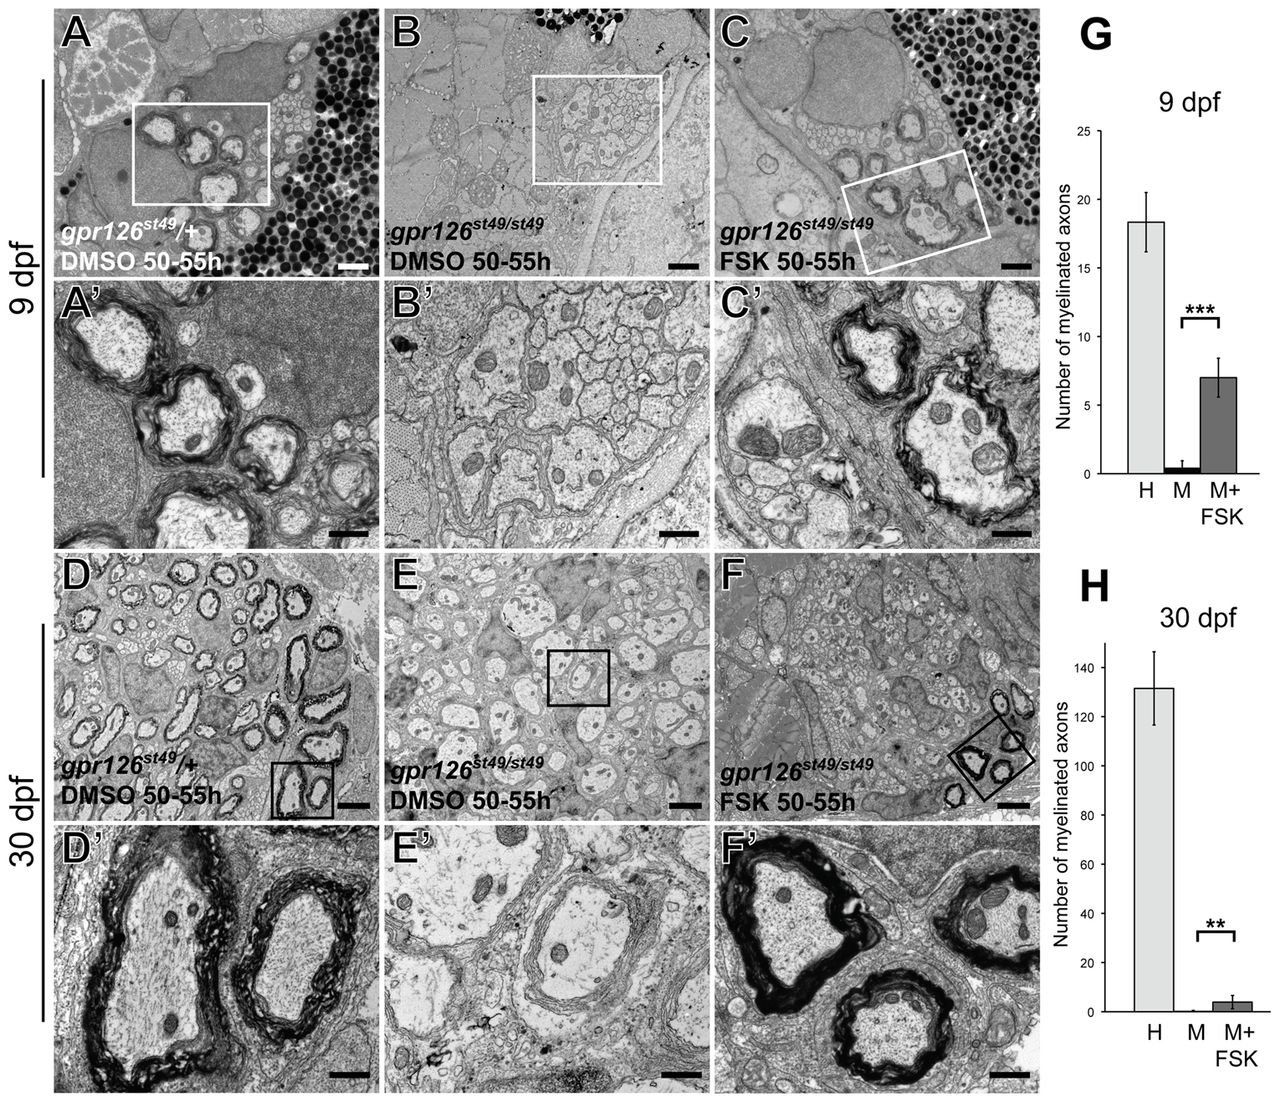
Schwann cell membrane wrapping, compaction, and the maturation of the myelin sheath proceed in gpr126 mutant nerves after transient elevation of cAMP. (A-C2) TEM images of transverse sections through zebrafish larvae at 9 dpf showing the ultrastructure of the PLLn one week following a pulse treatment with either DMSO (A,B) or 50 μM FSK (C). (A) gpr126st49/+ control DMSO-treated fish have normal myelination in the PLLn. (B) The PLLn of gpr126st49/st49 mutant larvae has no myelinated axons at 9 dpf. (C) The PLLn of gpr126st49/st49 mutant larvae that were treated with FSK from 50 to 55 hpf contains some rescued myelinated axons. A2-C2 show higher magnification TEM images of the boxed regions in A-C, respectively. (D-F2) TEM images of transverse sections through juvenile zebrafish at 30 dpf showing the ultrastructure of the PLLn four weeks following a pulse treatment with either DMSO (D,E) or 50 μM FSK (F). (D) gpr126st49/+ control DMSO-treated fish have normal myelination in the PLLn at 30 dpf. (E) The PLLn of gpr126st49/st49 mutant fish has no myelinated axons at 30 dpf. (F) The PLLn of gpr126st49/st49 mutant fish that were treated with FSK from 50 to 55 hpf contains a subset of rescued myelinated axons. D2-F2 show higher magnification TEM images of the boxed regions in D-F, respectively. (G,H) Quantification of the number of myelinated axons present per PLL nerve in heterozygous (H), mutant (M) and FSK-treated mutant (M+FSK) nerves at 9 dpf (G) and 30 dpf (H). Error bars represent s.d. Significance with two-tailed Student’s t-test: ***P<0.001, **P<0.01. Scale bars: 1 μm in A-C; 0.5 μm in A2-C2,D2-F2 2 μm in D-F.