
Fig. 5
|
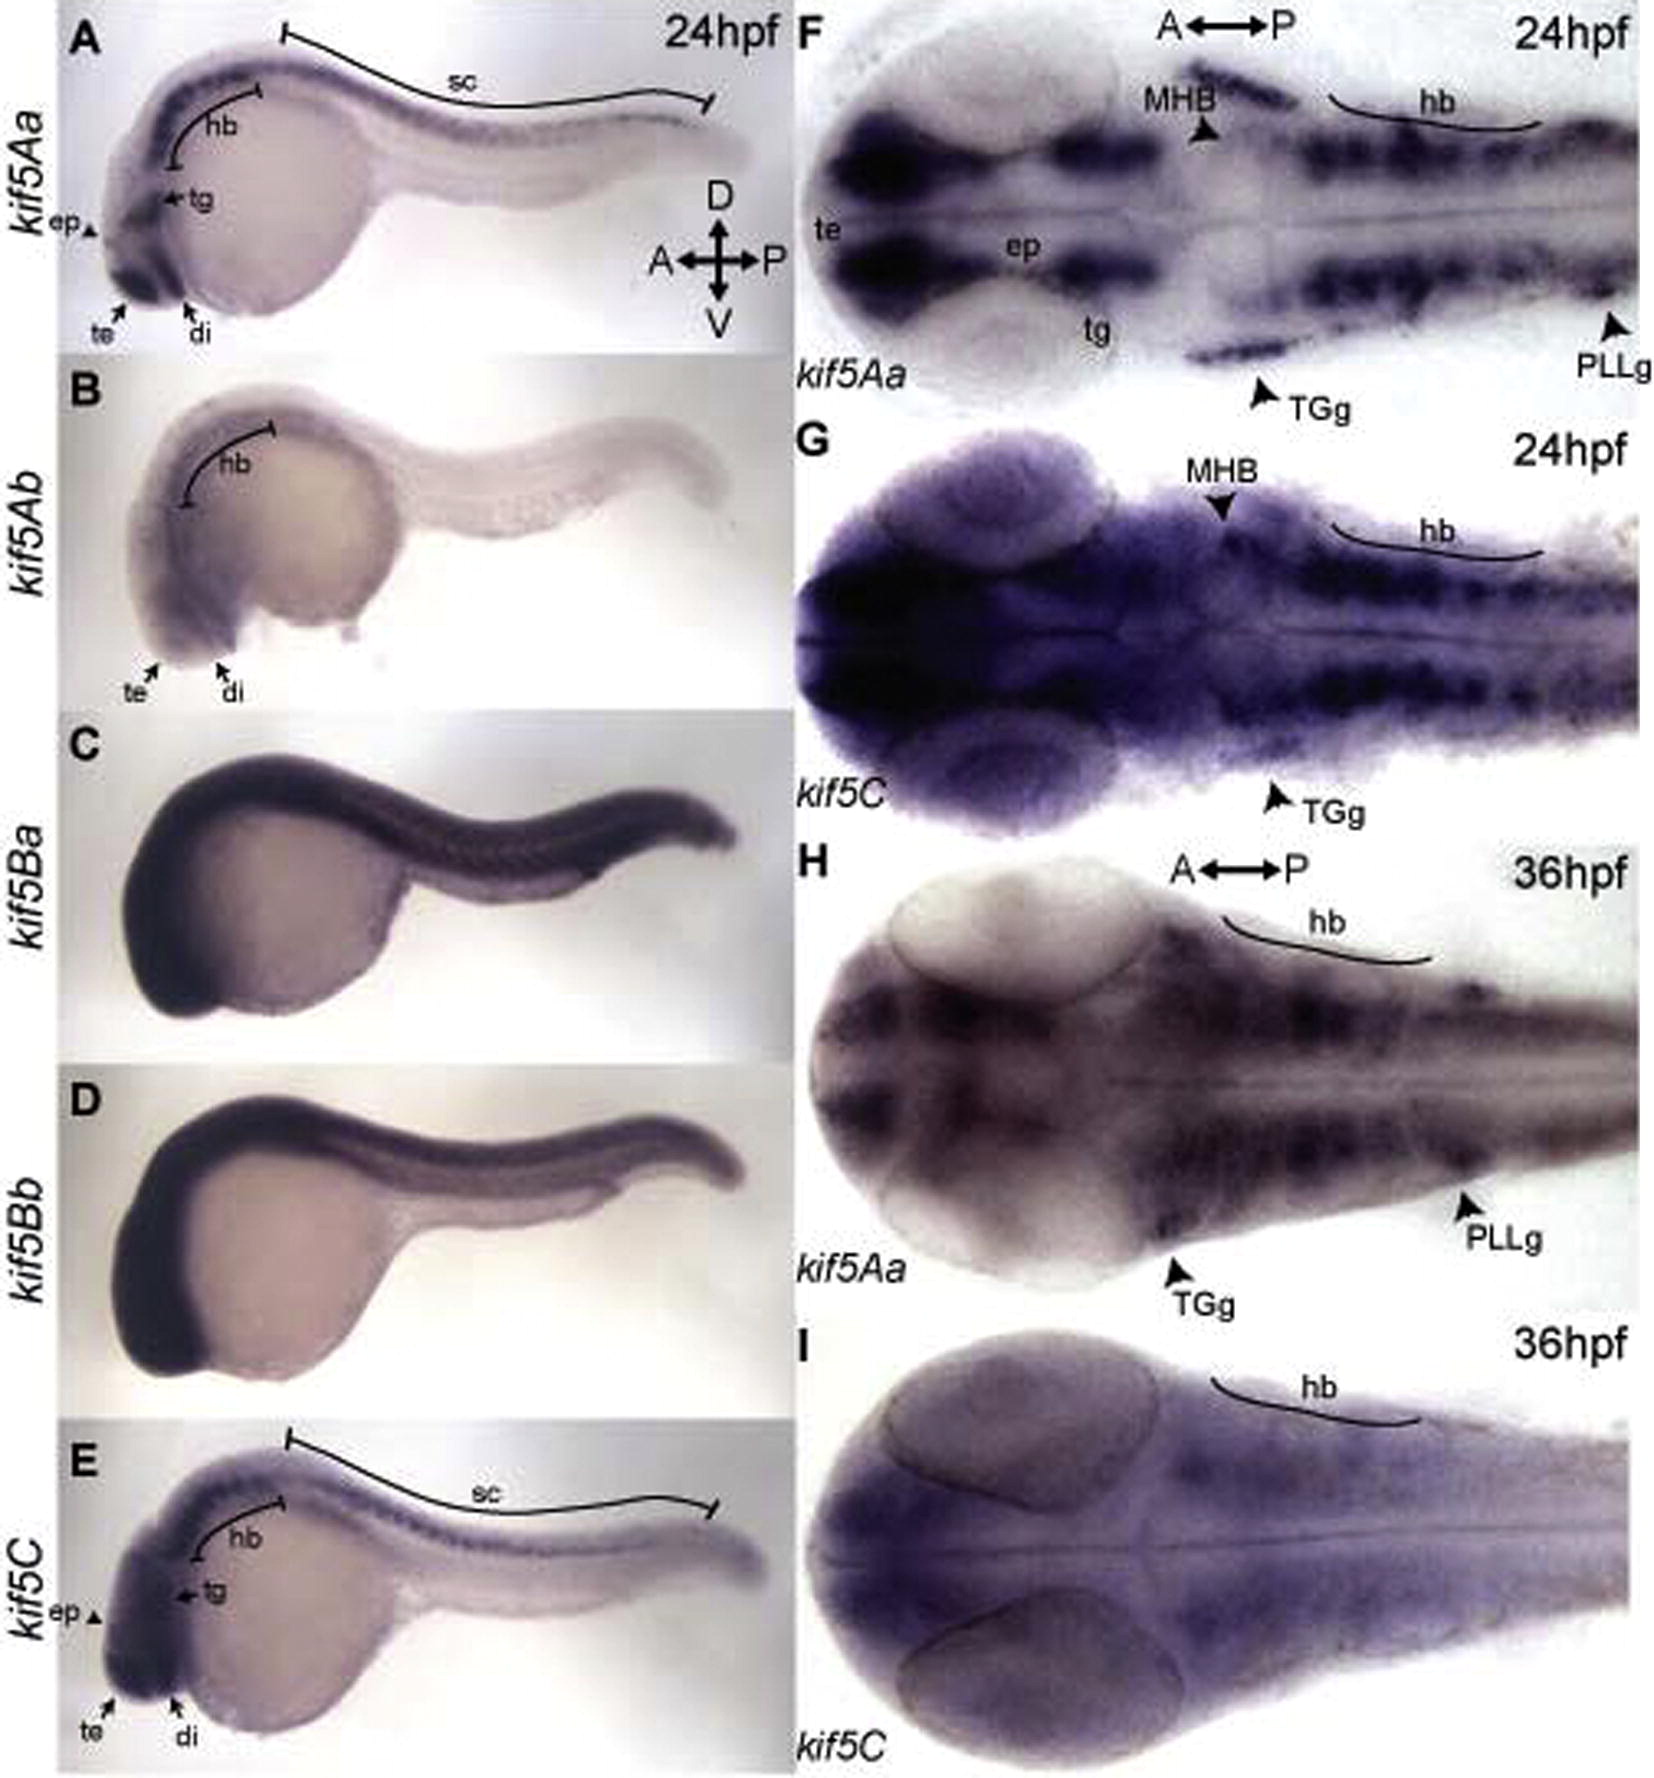
Fig. 5 Expression of kif5s at 24 hpf and 36 hpf. (A–E) Lateral views of whole mount in situs at 24 hpf. kif5Aa, kif5Ab, and kif5C were detected in the telencephalon (te), diencephalon (di), and hindbrain (hb). kif5Aa and kif5C were also detected in the tegmentum (tg), epiphysis (ep), and spinal cord (sc). kif5Ba and kif5Bb were ubiquitously expressed. (F, G) Dorsal view of flat mounts at 24 hpf. kif5Aa and kif5C were detected in the midbrain-hindbrain boundary (MHB) and trigeminal ganglia (TGg). kif5Aa was also detected in the posterior lateral line ganglia (PLLg) while kif5C was more broadly expressed in other tissues. (H, I) Dorsal view of flat mounts at 36 hpf. Anterior is to the left, dorsal to the top for A–E. Anterior is to the left for F–I. MHB, midbrain–hindbrain boundary.
Reprinted from Gene expression patterns : GEP, 13(7), Campbell, P.D., and Marlow, F.L., Temporal and tissue specific gene expression patterns of the zebrafish kinesin-1 heavy chain family, kif5s, during development, 271-279, Copyright (2013) with permission from Elsevier. Full text @ Gene Expr. Patterns