
IMAGE
Fig. 3
Image
|
Figure Caption
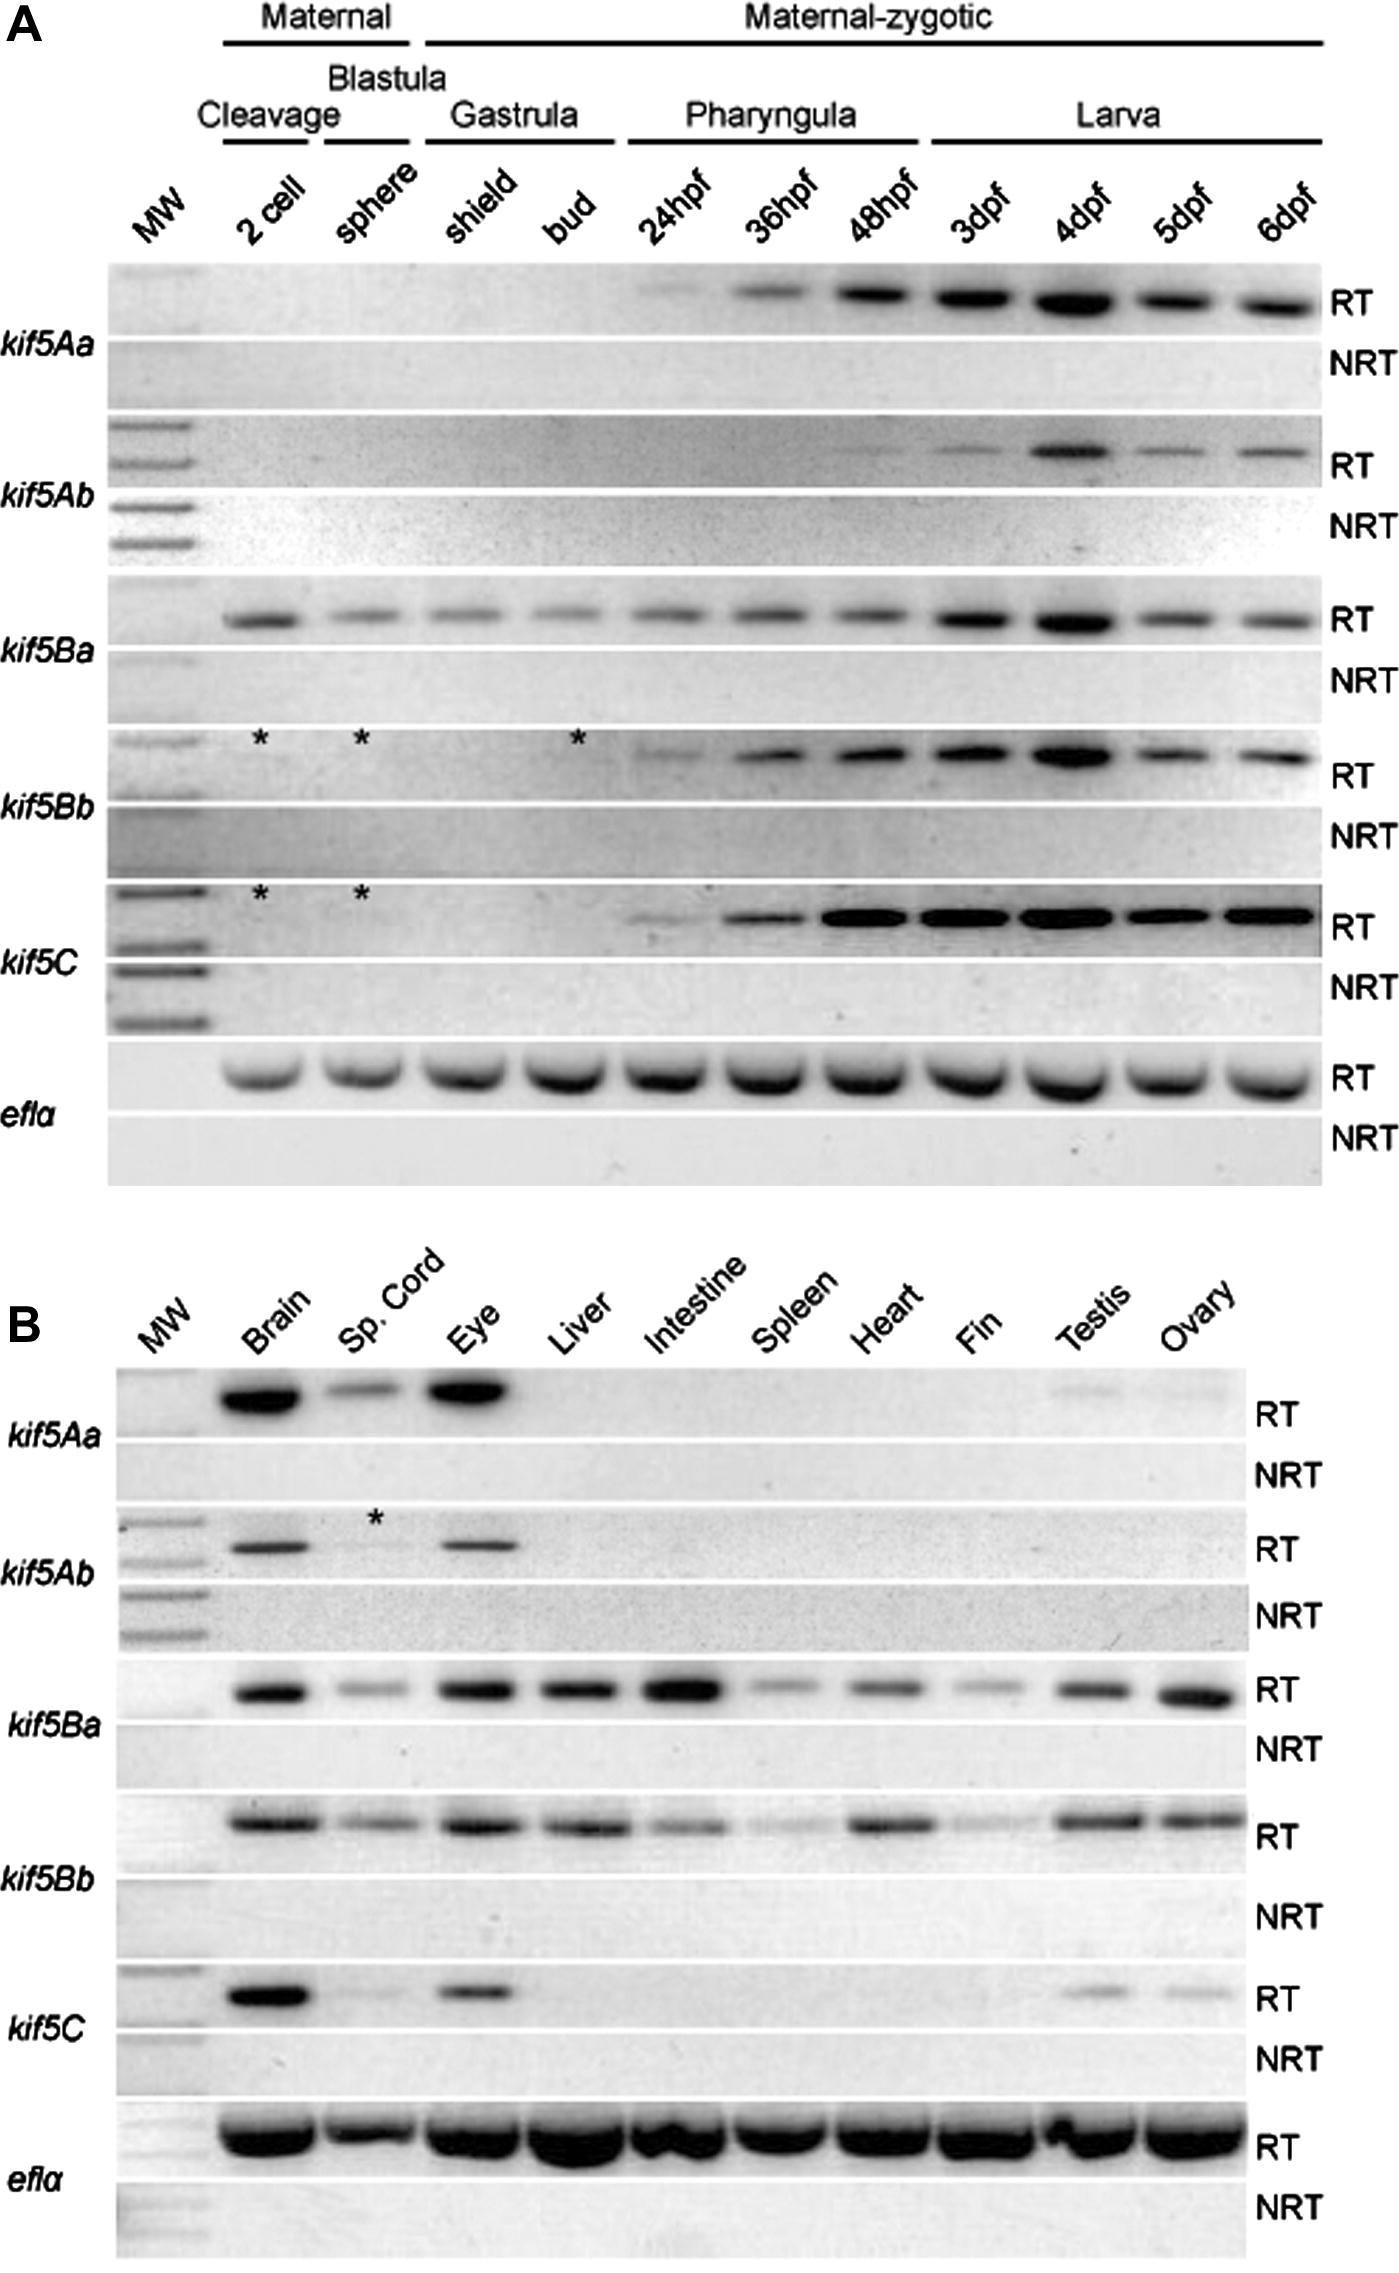
Fig. 3 (A) Temporal analysis of zebrafish kif5s during development by RT-PCR. (B) RT-PCR analysis of zebrafish kif5 tissue and organ specific expression. Asterisk () indicates faint bands present. NRT, no reverse transcriptase.
Figure Data
Acknowledgments
This image is the copyrighted work of the attributed author or publisher, and
ZFIN has permission only to display this image to its users.
Additional permissions should be obtained from the applicable author or publisher of the image.
Reprinted from Gene expression patterns : GEP, 13(7), Campbell, P.D., and Marlow, F.L., Temporal and tissue specific gene expression patterns of the zebrafish kinesin-1 heavy chain family, kif5s, during development, 271-279, Copyright (2013) with permission from Elsevier. Full text @ Gene Expr. Patterns