
|
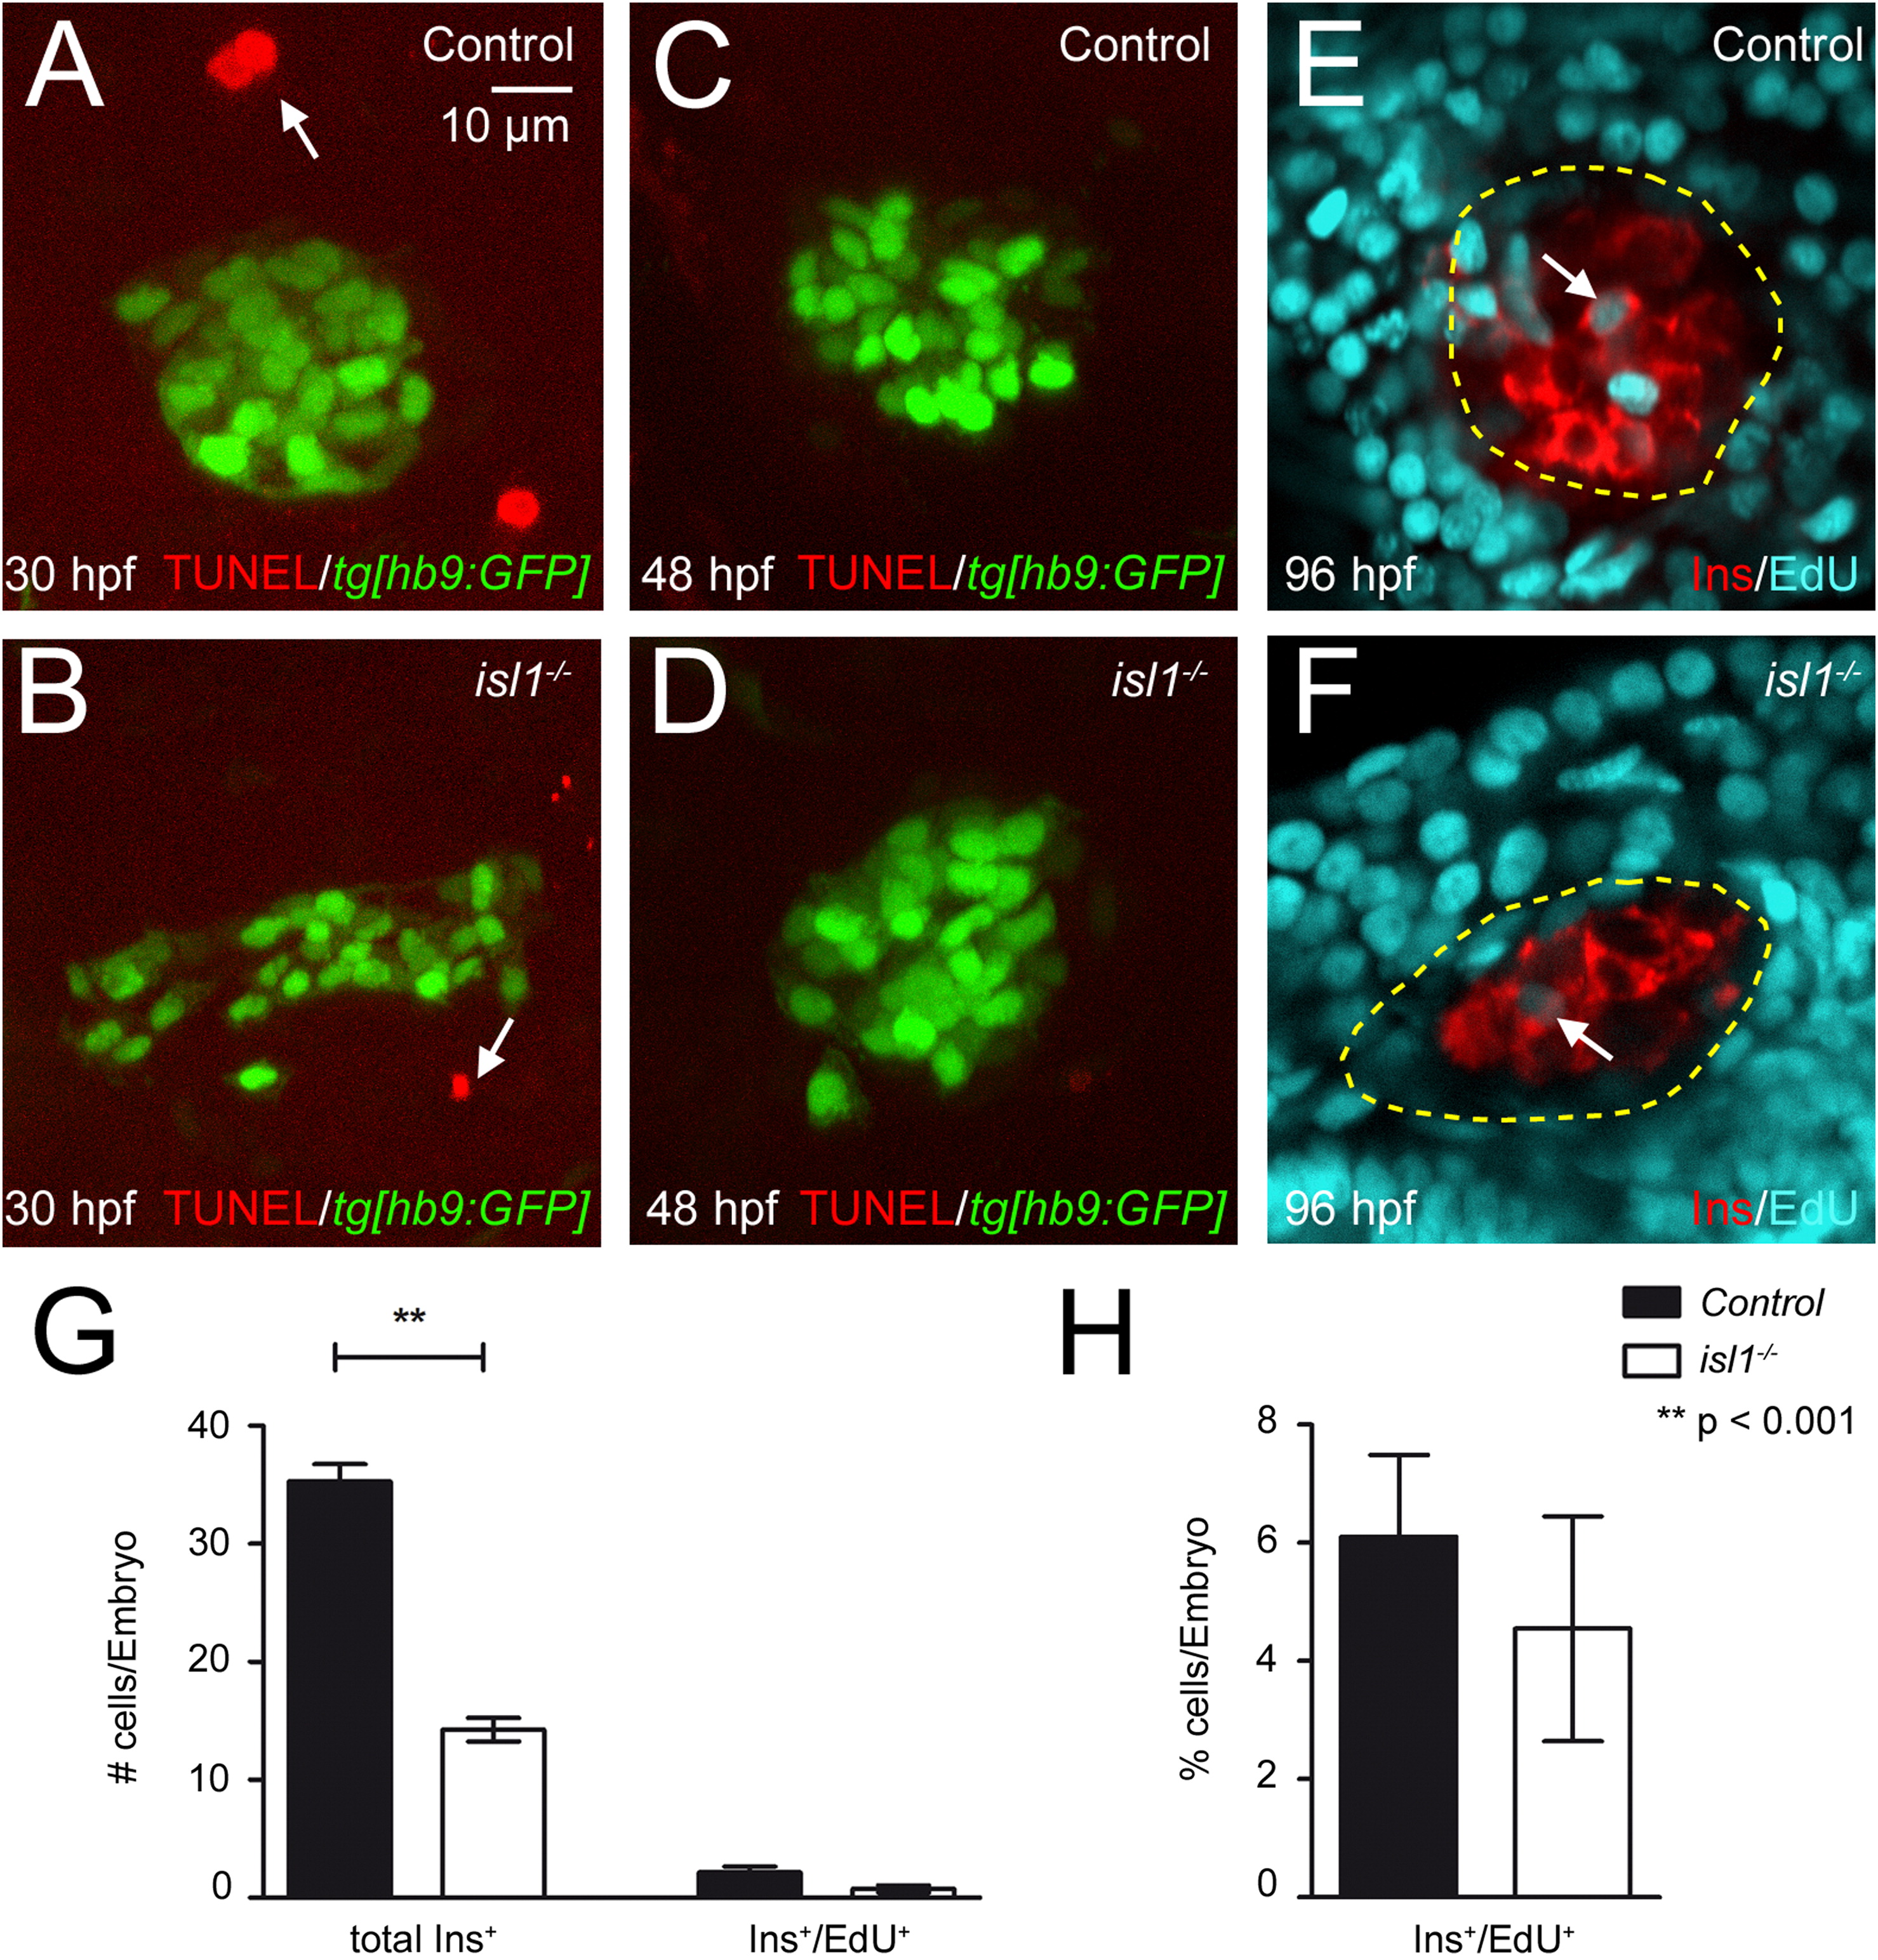
Fig. 7 TUNEL and EdU assays on control and mutant embryos. (A–D) Confocal image projections of 30 hpf (A+B) and 48 hpf (C+D) old control and isl1 mutant embryos in the tg[hb9:GFP] background after TUNEL labeling for apoptotic cells. The arrow highlights individual TUNEL+ cells in the vicinity of the GFP labeled islet. No TUNEL+ cells were found within the pancreatic islet of control or mutant fish at all analyzed stages. (E+F) Confocal sections of 96 hpf embryos labeled for Ins (in red) and EdU (in blue). Embryos were treated with EdU from 48 hpf to 96 hpf. Note that very few EdU+ cell are present within the islet (highlighted by yellow circle), while most of the nuclei in the surrounding exocrine tissue are EdU-positive. All images show ventral view, anterior to the left. (G) Numbers of Ins+ and Ins+/EdU+ cells in control and isl1 mutants. (H) Percentage of EdU+/Ins+ cells in relation to the number of Ins+ cells. Bars show mean+SEM.
Reprinted from Developmental Biology, 378(1), Wilfinger, A., Arkhipova, V., and Meyer, D., Cell type and tissue specific function of islet genes in zebrafish pancreas development, 25-37, Copyright (2013) with permission from Elsevier. Full text @ Dev. Biol.