
|
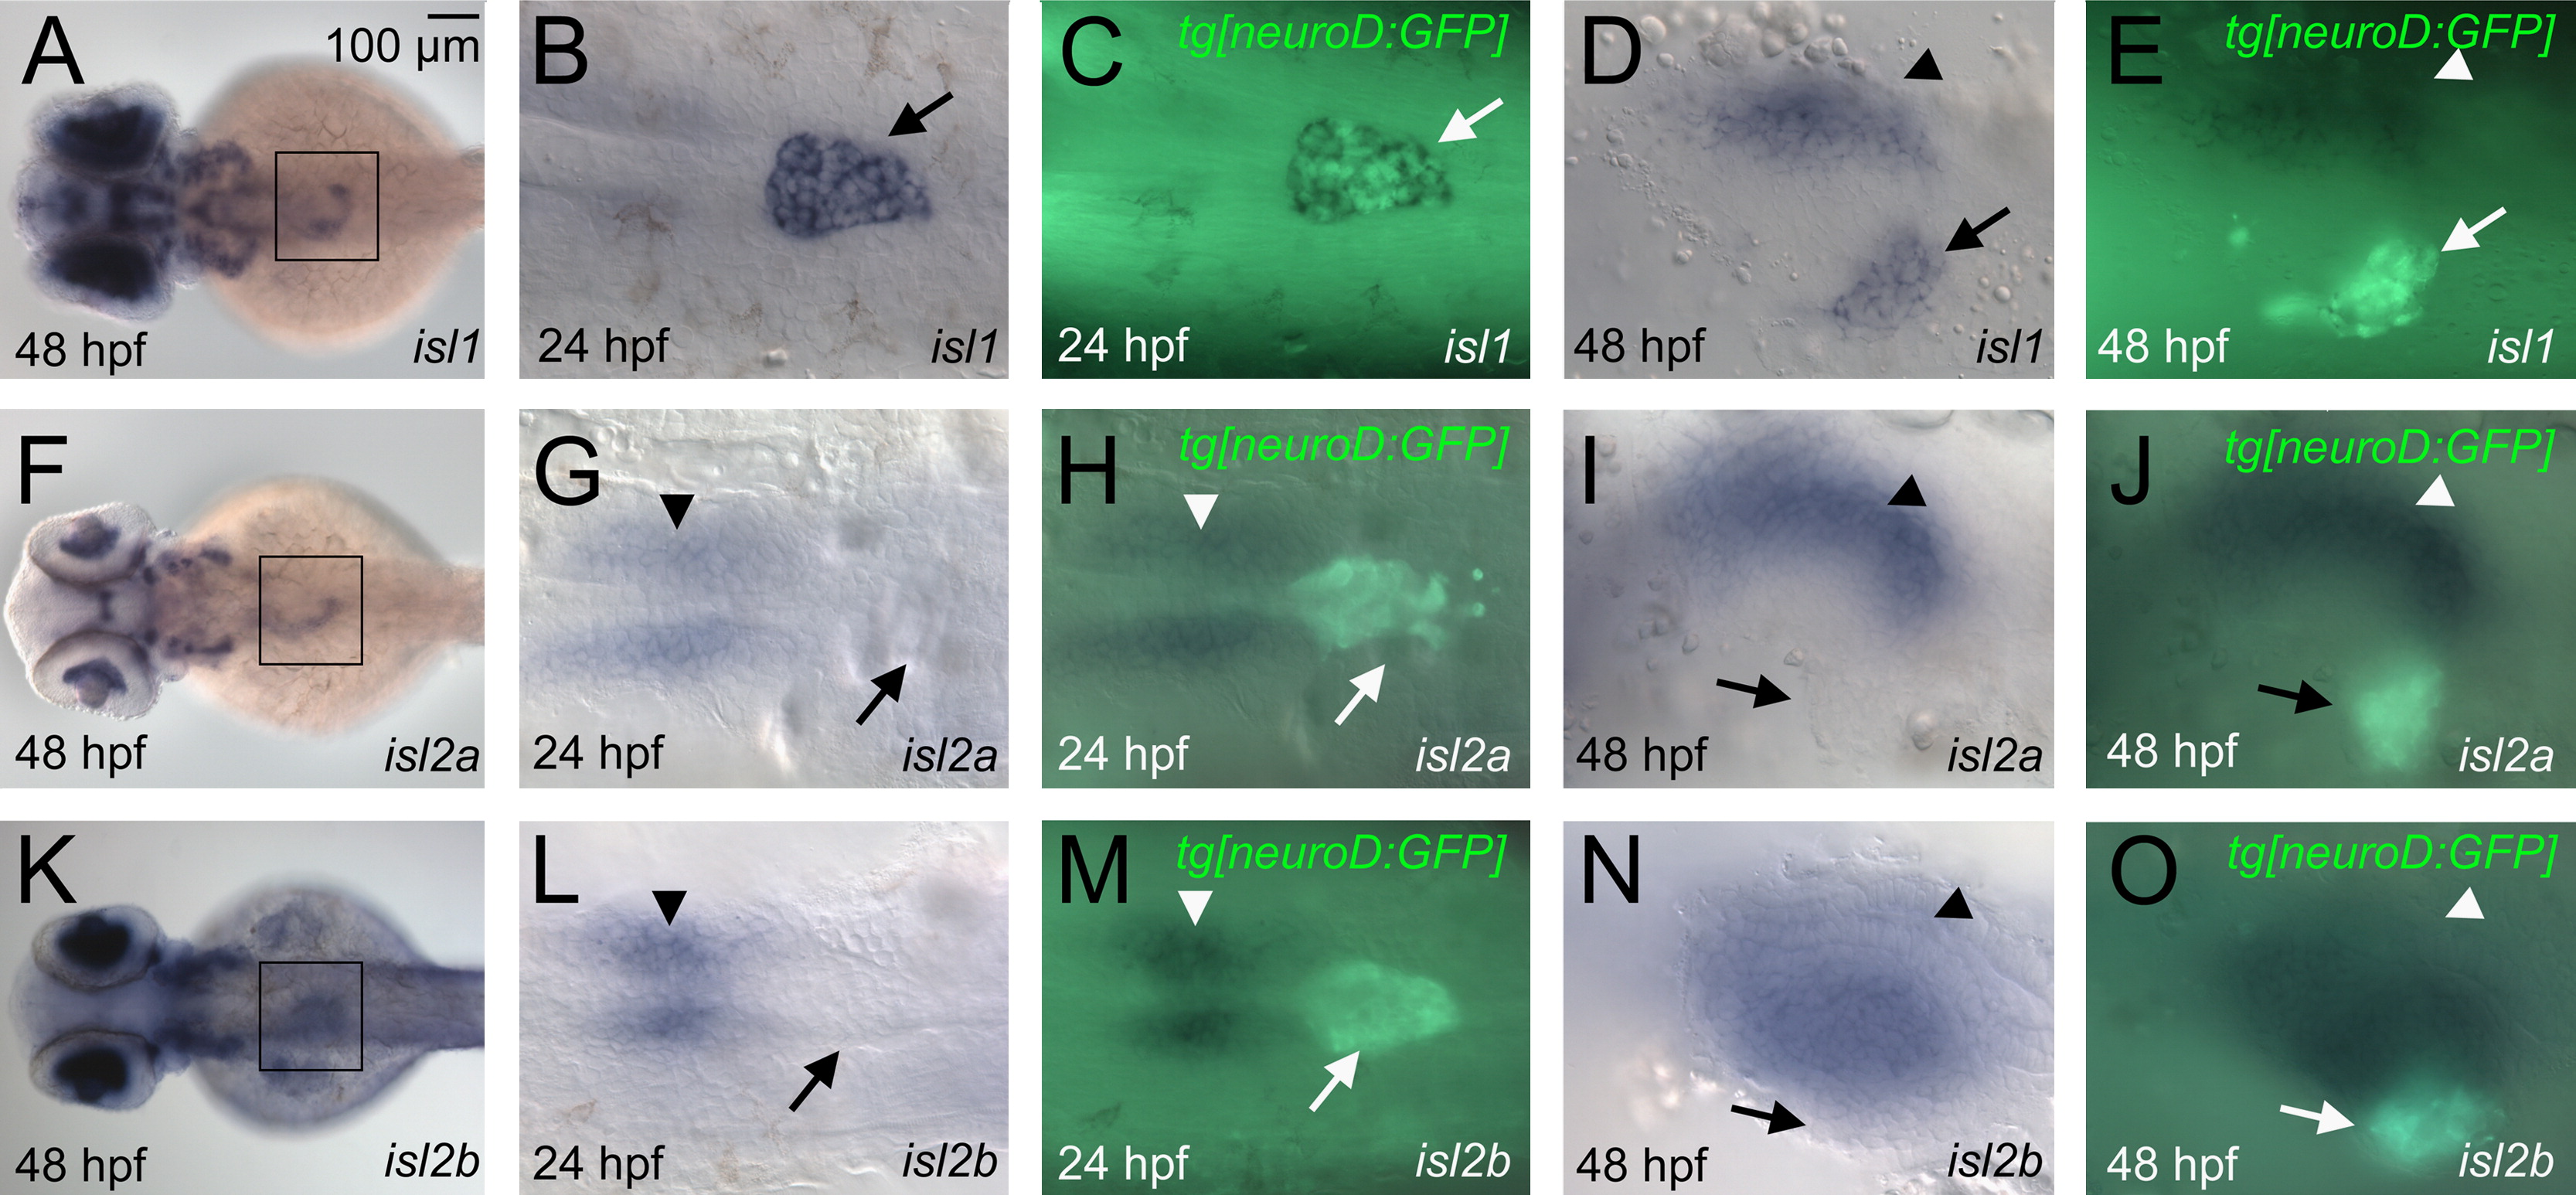
Fig. 3 Pancreatic expression of isl1, isl2a and isl2b. Comparison of isl1 (A–E), isl2a (F–J) and isl2b mRNA (K–O) expression at 24 hpf (B, C, G, H, L, M) and 48 hpf (A, D–F, I–K, N, O). Embryos are shown from the dorsal (A, F, K) or ventral view (rest). Insets shown in the overview images (A, F, K) indicate the relative position of the higher resolution images shown on the right side. The mRNA stains were performed in tg[neuroD:GFP] embryos in which immunofluorescence detection of GFP (green signals in C, E, H, J, M, O) was used to highlight endocrine cells (arrows mark the position of the pancreatic islet). Note that only isl1 signals overlap with GFP. Expression of isl2a is found in the mesenchyme anterior the endocrine cells at 24 hpf and left of the GFP labeled endocrine cells at 48 hpf in a pattern overlapping with that of the mesenchymal isl1 expression (arrowheads mark similar position in all embryos). Signals for isl2b are also found anterior to the endocrine cells at 24 hpf (arrowhead) and in a broader mesenchymal domain directly adjacent to the GFP signals at 48 hpf.
Reprinted from Developmental Biology, 378(1), Wilfinger, A., Arkhipova, V., and Meyer, D., Cell type and tissue specific function of islet genes in zebrafish pancreas development, 25-37, Copyright (2013) with permission from Elsevier. Full text @ Dev. Biol.