
Fig. 1
|
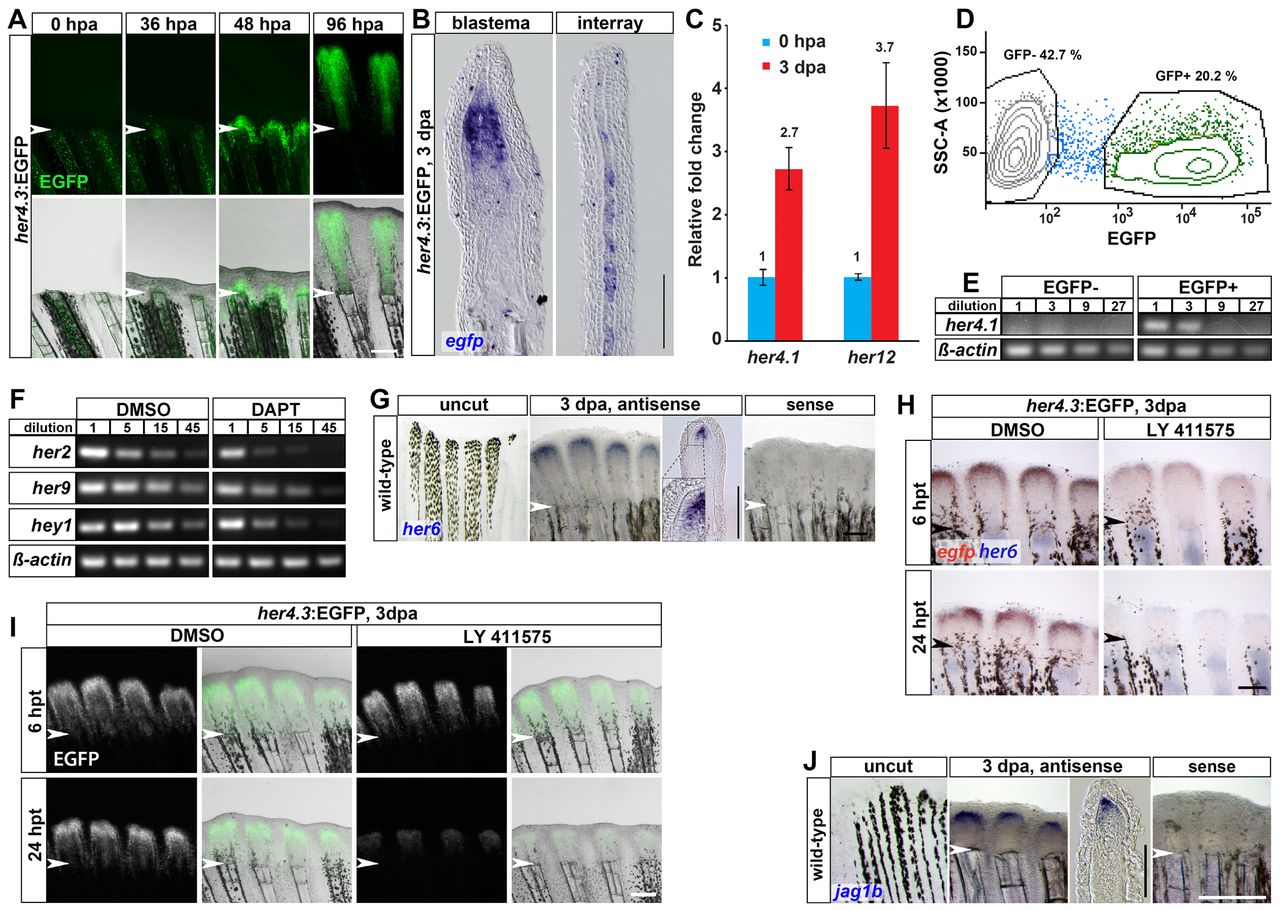
Fig. 1 Notch signaling is activated in the blastema during regenerative outgrowth. (A) EGFP fluorescence in her4.3:EGFP transgenics. By 96 hpa, EGFP signal is strongly intensified (exposure times: 0, 36 and 48 hpa for 7 seconds; 96 hpa for 0.5 seconds). (B) Longitudinal sections of her4.3:EGFP regenerates at 3 dpa stained for egfp. There is expression in the proximal but not the distal blastema, and weak expression in interray tissue. (C) her4.1 and her12 levels in 3 dpa regenerates measured by qRT-PCR, shown relative to the level in the distal-most stump segment at 50% fin length (0 hpa). (D) FACS scatterplot showing cell fractions of EGFP+ and EGFP- cells from dissociated 4 dpa her4.3:EGFP regenerates. (E) Endogenous her4.1 transcripts can be detected only by semi-quantitative PCR in the EGFP+ fraction of her4.3:EGFP regenerates. (F) her2, her9 and hey1 expression is downregulated in 3 dpa regenerates treated with DAPT for 6 hours. (G) her6 is expressed in the blastema at 3 dpa. (H) her4.3-driven egfp transcripts (red) and endogenous her6 (blue) are downregulated in regenerates treated with LY411575 6 hours after the start of treatment (hpt) (n=6/6 fins) and not detectable at 24 hpt (n=5/6). (I) her4.3-driven EGFP fluorescence is downregulated in 3 dpa regenerates treated with LY411575 for 24 hours, but not for 6 hours. (J) jag1b is expressed in the blastema at 3 dpa. (A-J) Arrowheads indicate amputation plane. Scale bars: whole mounts, 200 μm; sections, 100 μm.