
|
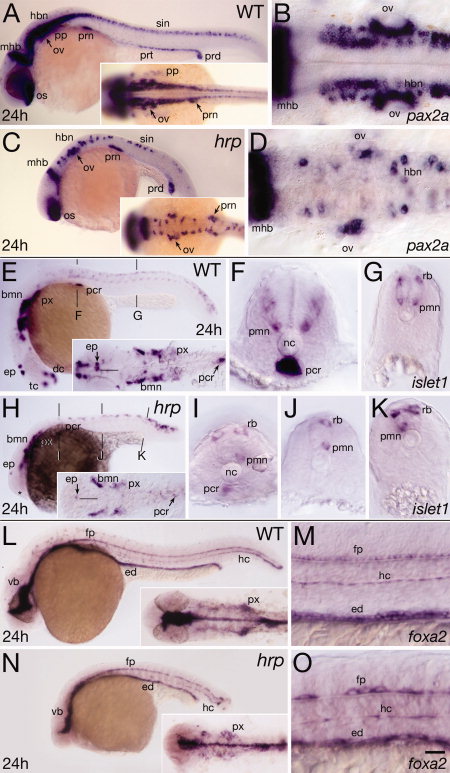
Fig. 4
Neural patterning defects in harpy mutants. Panels show wild-type reference embryos and harpy mutants. A–D: Expression of pax2a at 24 hr. Note that the diminution of expression in each domain is the result not of lowered expression in individual cells but of lower total numbers of positive cells. A,C: Whole-mount side views; insets show dorsal views of head-trunk region. B,D: High resolution dorsal views of hindbrain. E–K: Expression of islet1 at 24 hr. E,H: Whole-mount side views; insets show dorsal views of head region. The midline of the central nervous system (CNS; black line) is indicated near the epiphysis. F,G,I–K: Transverse sections at levels indicated in whole-mounts. Note lacking primary motor neurons, normally a bilaterally paired structure. L–O: Expression of foxa2 (axial) at 24 hr. L,N: Show a whole-mount side view; insets show dorsal views of head region. M,O: Show high resolution side views of trunk. Note the gaps between the large cells of the mutant floor plate and hypochord. bmn, branchio-motor nuclei; dc, diencephalon; ep, epiphysis; ed, endoderm; fp, floor plate; hbn, hindbrain neurons; hc, hypochord; mhb, midbrain–hindbrain border; nc, notochord; os, optic stalk; ov, otic vesicle; pcr, pancreas; pp, pharyngeal pouch; pmn, primary motor neurons; prn pronephric neck; prt pronephric tubule; prd, pronephric duct; px, pharynx; rb, Rohon-Beard sensory neuron; scn, spinal cord neurons; tc, telencephalon; vb, ventral brain. Scale bar = 100 μm in A,C,E,H,L,N, 40 μm in B,D,F,G,I,J,K,M,O.