
Fig. 2
- ID
- ZDB-IMAGE-130502-33
- Publication
- Saxena et al., 2013 - Sox10-dependent neural crest origin of olfactory microvillous neurons in zebrafish
- All Figures
- Figures for Saxena et al., 2013
|
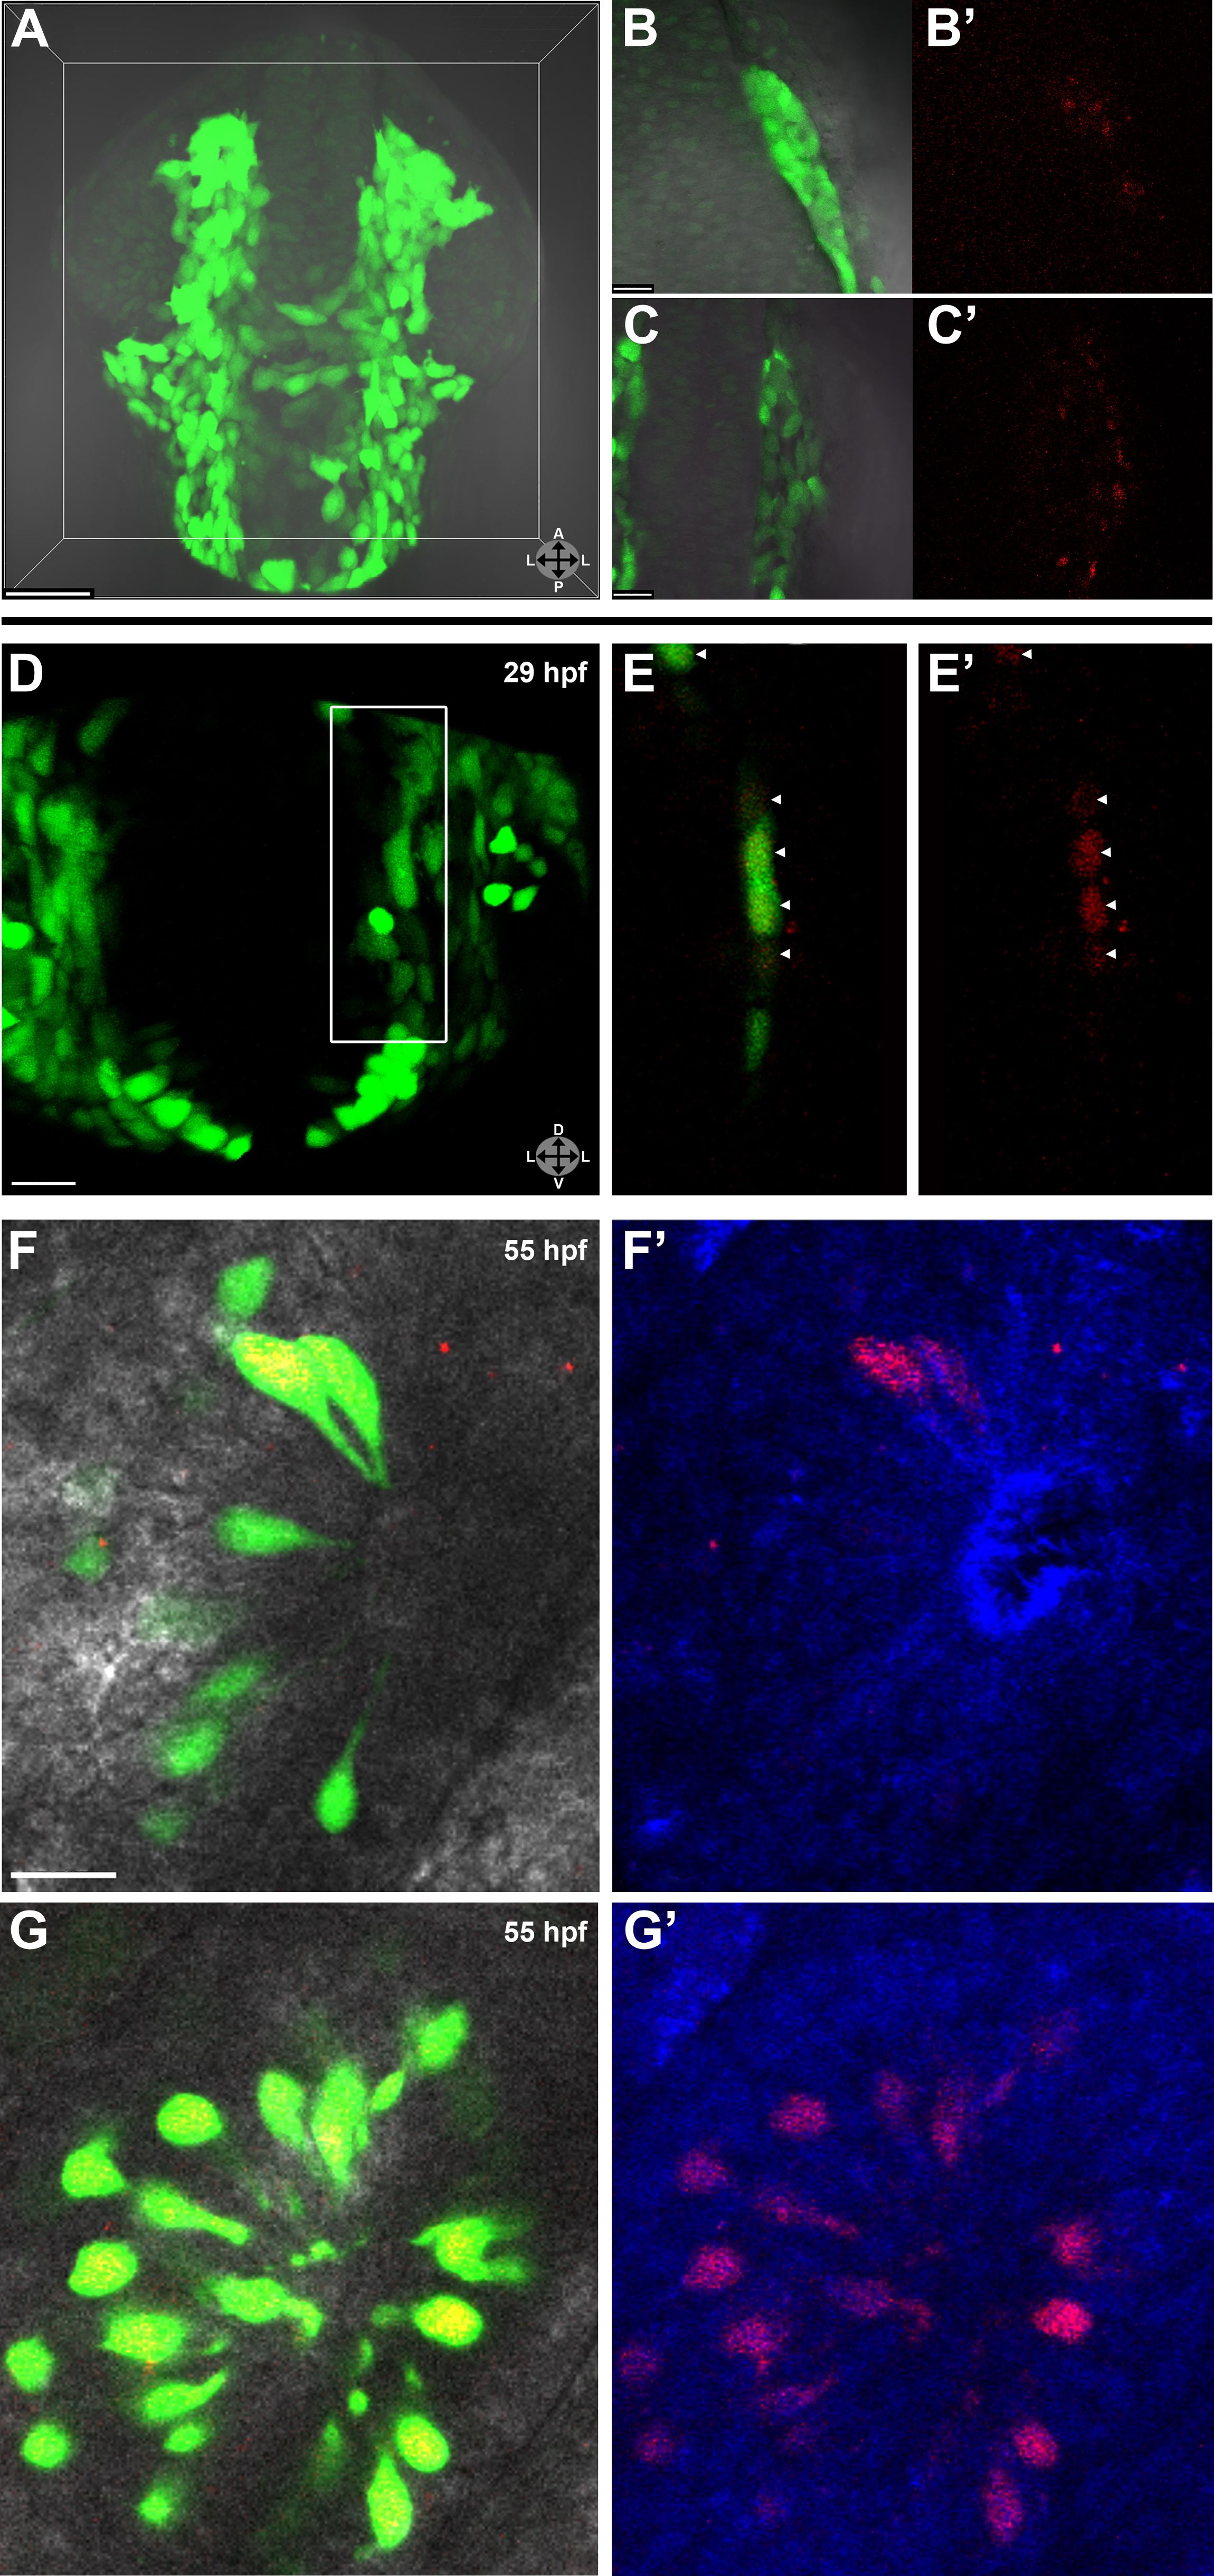
Fig. 2 Lineage tracing by photoconversion demonstrates neural crest origin of microvillous neurons.
(A) Nuclear Dendra2 (low level green) was photoconverted in Sox10:eGFP+ (bright green) neural crest cells at 14–16 hpf (10–14 somite stage) in live embryos. (B)–(C′) Representative example z-planes show unilateral photoconversion of a few cells (B and B′) or a large number of cells (C and C′). (B and C) show ubiquitous Dendra2 (low level green) and Sox10:eGFP (bright green), and (B′ and C′) show photoconverted Dendra2 (red). (D) Photoconverted cells are visible in the contralateral nasal cavity at 29 hpf; (E and E′) show a 2.5-μm-thick z-plane slice of the boxed area with photoconverted cells (red, arrowheads). (F and F′) At 55 hpf, photoconversion of a small number of cells (B and B′) results in a subset of Sox10:eGFP+ microvillous neurons being labeled by photoconverted Dendra2 on the contralateral side. (G and G′) Large-scale photoconversion (C and C′) labels most Sox10:eGFP+ microvillous neurons. Directly adjacent ciliated neurons are never labeled. (F–G′) z = 2.5 μm; Sox10:eGFP: green; Dendra2Green: blue; Dendra2Red: red; histology in brightfield. Orientation arrows: A: anterior; P: posterior; D: dorsal; V: ventral; L: lateral. Scale bars: 50 μm (A); 20 μm (B–D); 10 μm (F–G′). See alsoFigure 2—figure supplement 1.