
|
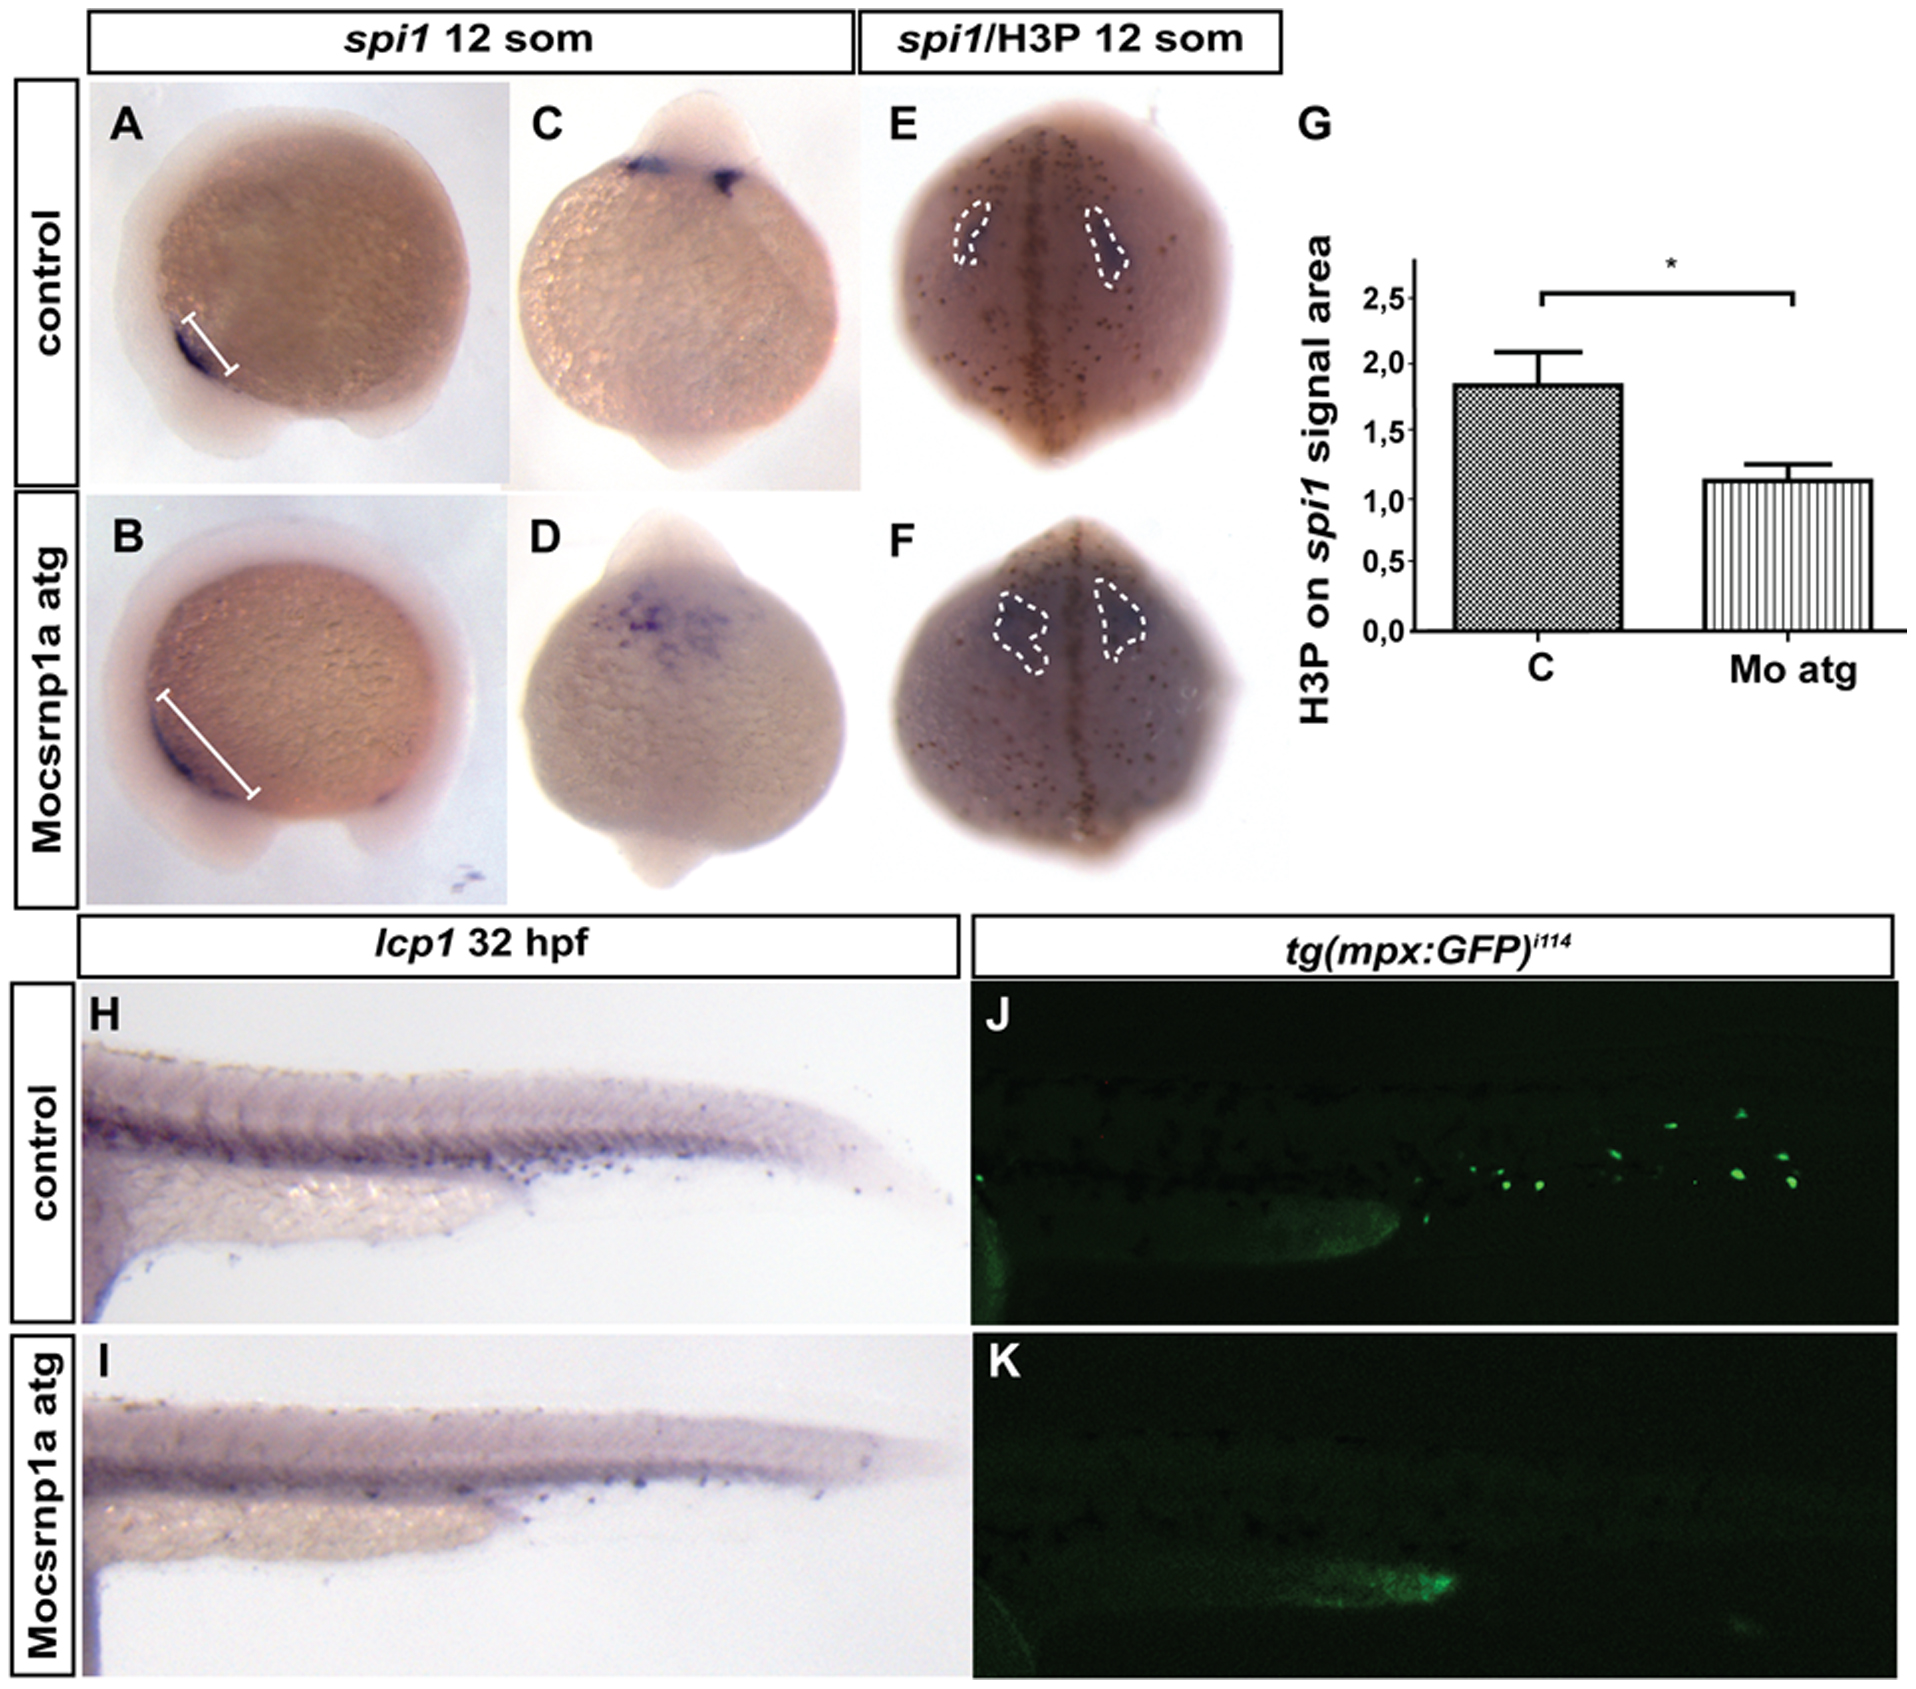
Fig. 6 Myeloid lineage is affected by csrnp1a knockdown.
Morphants embryos show an alteration in the spi1 signal (A to D; A, B lateral views anterior lo left; and D, E anterior views). 85,7% of control embryos exhibit normal spi1 expression pattern (n = 42/49) (A, C), while csrnp1a morphants exhibit altered spi1 expression in 59,2% (n = 61/103) (B, D). The spi1 changes are accompanied by a significant decrease in proliferation (showed as the number of H3P within the spi1 signal area) (E, F, and G). Finally, a decrease in the macrophage specific marker lcp1 (43,8%; n = 14/32) is evidenced by ISH (H, I), and a clear reduction in the neutrophil specific marker mpo is evident in the transgenic line expressing GFP under the mpo promoter Tg(Bacmpo:GFP)i114 (J, K)(47,2%; n = 25/53). All are lateral views, anterior to the left.