
|
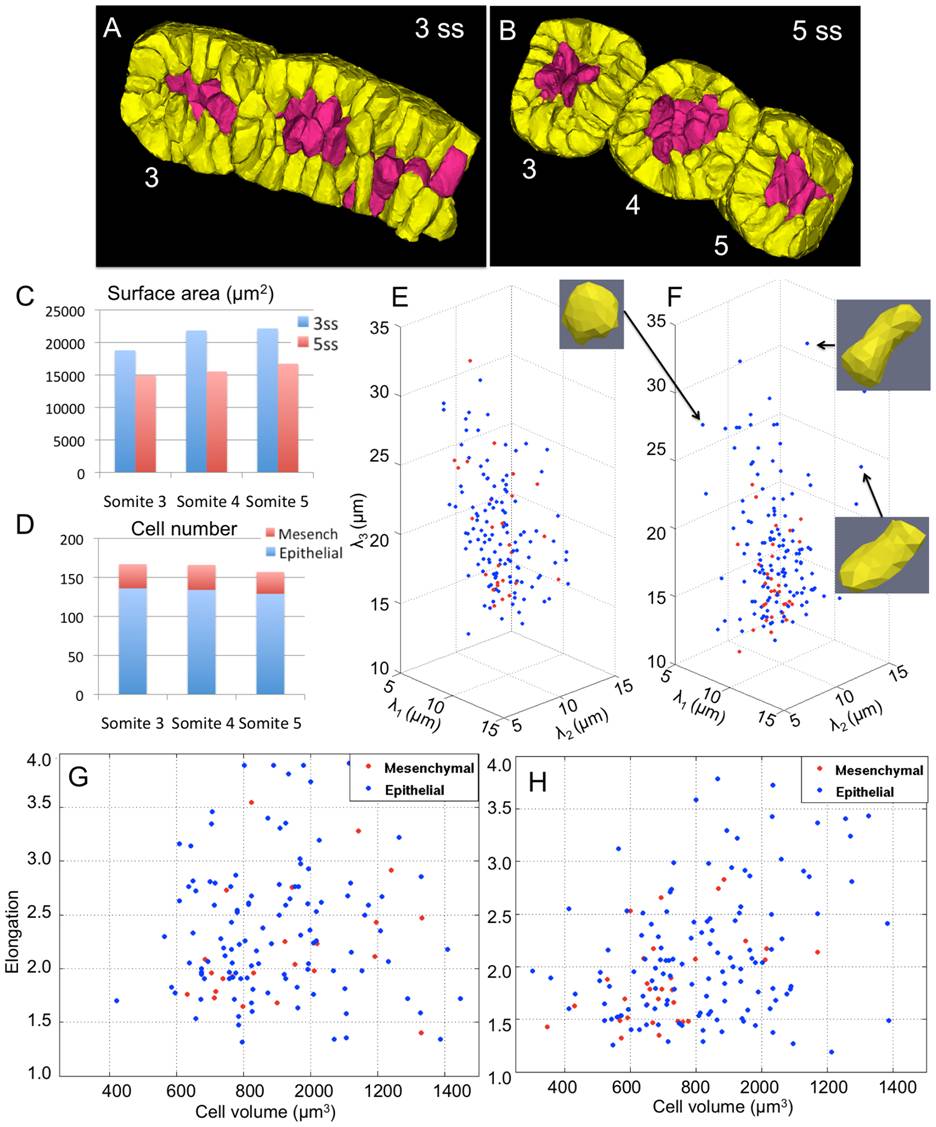
Fig. 9 Algorithm-enabled quantification of cell dynamics during somite formation.
Retrospective cell tracing of epithelial (yellow) and mesenchymal (red) cells from formed somites at (B) 5ss back to the presomitic mesoderm at (A) 3ss. (C) Corresponding decrease in somite tissue surface area during the formation of somites 3, 4, and 5. (D) Epithelial and mesenchymal cell numbers in respective somites at 5ss. (E,F) Three-dimensional cell shape quantified by the length of their principal axes at 3ss and 5ss. (G,H) Scatter plots of elongation (2λ3/λ1+λ2) and cell volumes at 3ss and 5ss. The two cell populations show different behavior. Statistical analysis of the two distributions show that mesenchymal cells (red) tend to cluster, round-up, and shrink in size on average.