
|
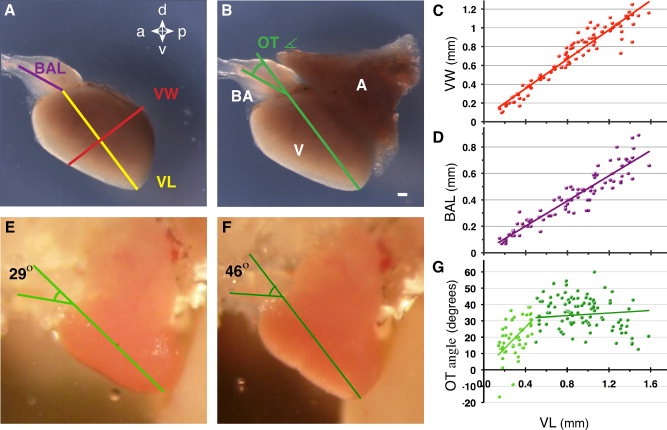
Fig. 3 Quantitative cardiac analysis. To better understand cardiac maturation, we carried out a series of quantitative analyses. A,B: Measurements taken for each external cardiac feature; for better characterization of the ventricular morphology, the atrium in (B) has been removed in (A). Bulbous arteriosus length (BAL- purple), ventricle length (VL- yellow), and ventricle width (VW- red) are labeled. B,E,F: The outflow tract angle (OT angle) is indicated in green. C: VW increases linearly with VL. D: BA length increases linearly with VL, staying approximately half the length of the ventricle. The outflow tract (OT) angle changes throughout each cardiac contraction by as much as 30°. E,F: Images extracted from a Supp. Movie S5 demonstrate a minimal OT angle of 29° during ventricular ejection (E) and a maximal OT angle of 46° following atrial systole (F). G: During embryonic and larval development that ends at a VL of 0.5 mm, the OT angle, increases quickly followed by a period of very slow change through adulthood. BA, bulbous arteriosus; V, ventricle; A, atrium; a, anterior; p, posterior; d, dorsal; v, ventral orientation. Scale bar = 100 μm.