
|
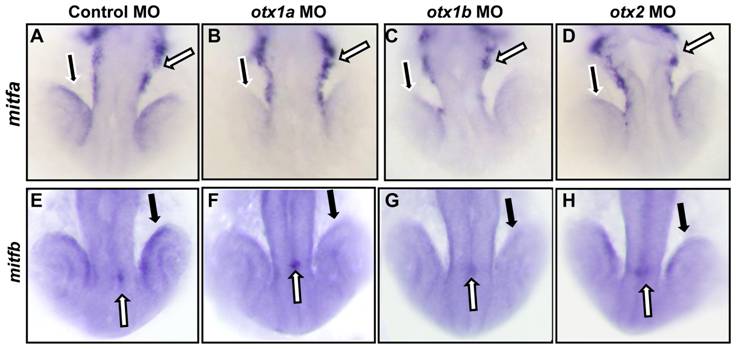
Fig. 5 mitfa and mitfb expression is decreased in otx morphants.
Expression of mitfa (A–D) and mitfb (E–H) was examined through in situ hybridization at the 21 somite stage in embryos injected with a control morpholino (A,E), or morpholinos against otx1a (B,F), otx1b (C,G), or otx2 (D,H). In situ hybridization analysis revealed a decrease in mitfa expression in the developing RPE cells (black arrows) but not in the neural crest cells (white arrows) of otx single morphants (D) and when compared to controls (A). mitfb expression was also reduced specifically in the RPE (black arrows) of otx morphants (F–H) compared to the controls, leaving epiphysis expression unaffected (white arrows). All morphants were processed simultaneously with approximately 50 larvae for each condition and the experiment was repeated twice.