
Fig. 2
|
Fig. 2
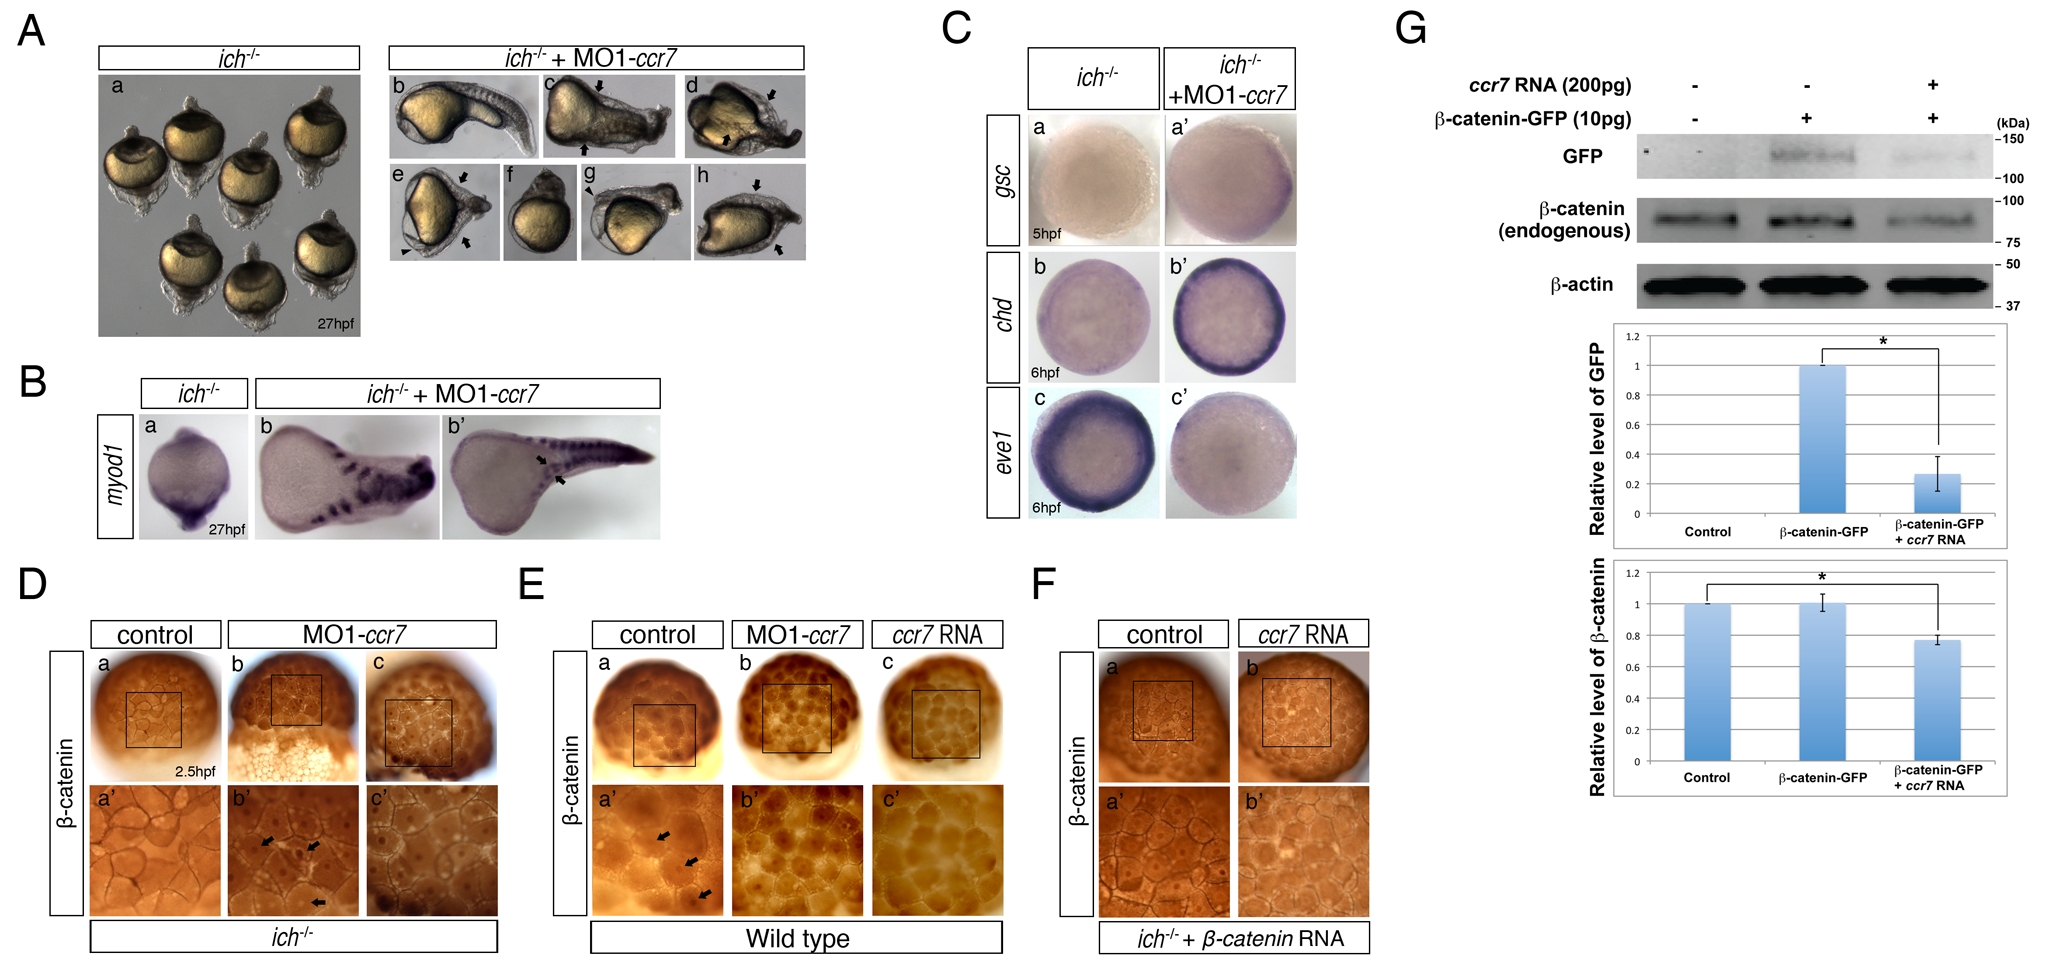
Depletion of Ccr7 activity partially rescues axis formation in ichabod mutants.
(A) Penetrance of strongly ventralized phenotypes displayed by maternal β-catenin-2, ich, mutant embryos (a, 92%, n = 110) was reduced by injection of MO1-ccr7 (b–h, 10 ng; 40%, n = 98, five experiments). Arrows indicate partial axes and arrowheads indicate rudimentary head structures. (B) myod1 expression in uninjected (a) and MO1-ccr7-injected ich embryos (b,b2) revealed somitic tissue. Arrows indicate partial double axes. (C) In contrast to uninjected ich mutants (a,b,c), in MO1-ccr7-injected ich embryos, the organizer genes gsc (a2, n = 11/12) and chd (b2, n = 8/8) were expressed; while expression of the ventral gene, eve1, was significantly reduced (c2, n = 30/40). Animal views. (D) Lack of β-catenin nuclear accumulation, detected by immunostaining at 256-cell stage, in ich mutants (a), was suppressed in MO1-ccr7-injected ich embryos (b,c; n = 9/10, two experiments). (a2–c2) Higher magnification of boxed areas in a–c. (E) Dorsal domain of nuclear accumulation of β-catenin, detected by immunostaining at 256-cell stage in WT embryos (a), was expanded in ccr7 morphants (b; n = 6/13), while it was diminished in Ccr7 overexpressing embryos (c; n = 8/11). (a2–c2) Higher magnification of boxed areas in a–c. (F) Ectopic β-catenin nuclear accumulation, detected by immunostaining at 256–512-cell stage, in ich mutants injected with β-catenin RNA (a; 25 pg, n = 9/10), was suppressed by co-injecting ccr7 RNA (b; 150 pg, n = 7/10). (a2–b2) Higher magnification of boxed areas in a–b. (G) Ccr7 gain-of-function decreased both levels of endogenous β-catenin and ectopic β-catenin-GFP. Western blotting of β-catenin and GFP protein from uninjected control, β-catenin-GFP RNA (10 pg) injected, or β-catenin-GFP RNA (10 pg)/ccr7 RNA (200 pg) co-injected embryos (all at 3–3.3 hpf). Graphs below show the relative protein level (signal intensity) quantified from three separate immunoblots. * p<0.05.