
|
Fig. 10 Torsin1 is non-essential for early development of the motor system.
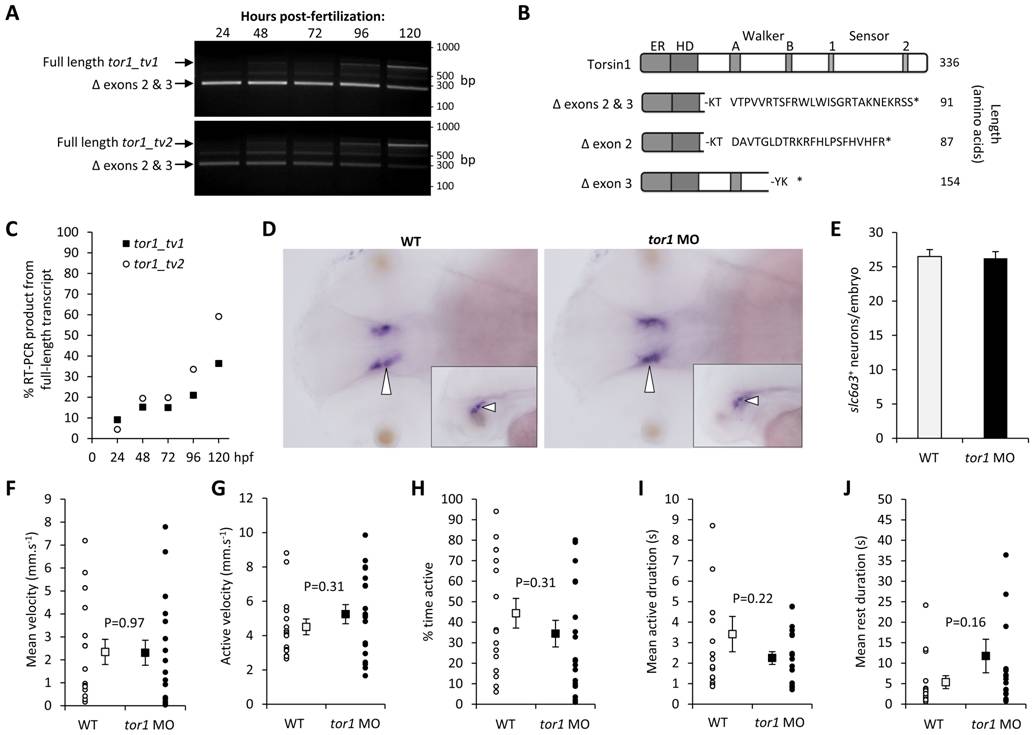
A: Single-cell zebrafish embryos were microinjected with morpholino oligonucleotides designed to block splicing of tor1 exons 2 and 3 (see figure 2). At the times indicated between 24 and 120 hours post-fertilization, RNA was harvested from developing zebrafish and subjected to RT-PCR using primers specific for tor1_tv1 (upper panel) or tor1_tv2 (lower panel). The pictures show ethidium bromide stained agarose gels after the PCR products were resolved by electrophoresis. The positions of PCR products corresponding to wild-type tor1 mRNA and the transcript lacking exons 2 and 3 are shown. B: A schematic representation is shown of the predicted protein products produced by transcripts lacking exons 2, 3 or both exons. It is not known if any of these truncated products is stable. C: The % tor1 RT-PCR product arising from the wild-type, full-length mRNA at each time point following MO injection was estimated by densitometry. D: Whole mount RNA in situ hybridization was carried out using a cRNA probe for slc6a3 (‘dat’) to localize dopaminergic neurons. Representative dorsal views are shown of the brains of an uninjected control embryo (left panel) and an embryo lacking Torsin1 (right panel) at 48 hours post-fertilization. The inset panels show representative lateral views. Developing dopaminergic neurons in the diencephalon are indicated by arrowheads. E: The total number of slc6a3+ cells in the diencephalon was counted in zebrafish lacking Torsin1 and control zebrafish at 48 hpf. Graphs show mean number of cells, error bars show standard error. F–J: Spontaneous movements of uninjected wild-type zebrafish (n = 16) and zebrafish injected with MO targeting tor1 (n = 19) were recorded at 5 dpf in 96-well plates using a video camera. Recordings were analyzed to determine: (F) mean velocity (total displacement/total time of recording); (G) active velocity (displacement/time spent moving); (H) % time active; (I) mean duration of active episodes; and (J) mean duration of rest episodes. For each graph, values for each individual larva are shown as small circles and the mean for the group shown as a filled square. Error bars shown standard error.