
Image
|
Figure Caption
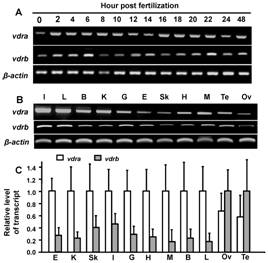
Fig. 4 Zebrafish vdra and vdrb expression profiles.
mRNA expression patterns in developing stages (A) and various tissues (B) were determined by an RT-PCR using β-actin as the internal control. (C) vdra and vdrb mRNA expressions in different tissues of adult zebrafish were analyzed by a qPCR using β-actin as the internal control. Values are the mean ± SD (n = 3). E, eye; K, kidney; Sk, skin; I, intestine; G, gill; H, heart; M, muscle; B, brain; L, liver; Ov, ovary; Te, testis.
Figure Data
Acknowledgments
This image is the copyrighted work of the attributed author or publisher, and
ZFIN has permission only to display this image to its users.
Additional permissions should be obtained from the applicable author or publisher of the image.
Full text @ PLoS One