
Image
|
Figure Caption
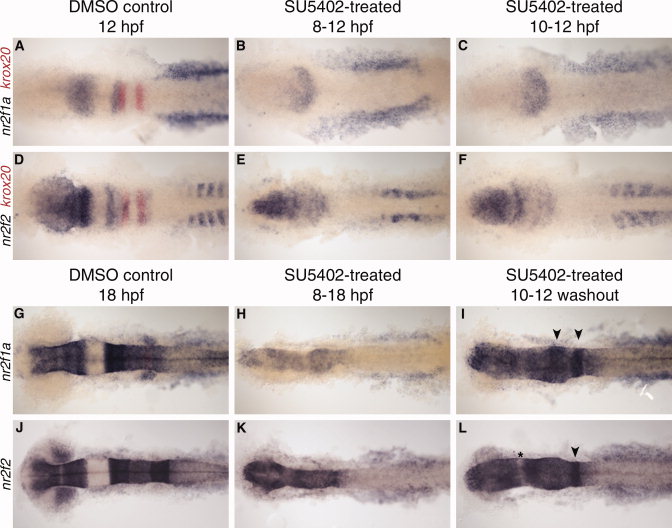
Fig. 7 nr2f expression at 12 and 18 hours post fertilization (hpf) after SU5402 treatment. A–F: nr2f1a and nr2f2 expression at 12 hpf. SU5402 treatment from 8–12 hpf (B,E) or 10–12 hpf (C,F). G–L: nr2f1a and nr2f2 expression at 18 hpf. SU5402 treatment from 8–18 hpf (H,K) or 10–12 hpf and washed out (I,L). Arrowheads indicate rhombomere-specific expression in the hindbrain. Asterisk indicates gap in expression, possibly between midbrain and hindbrain.
Figure Data
Acknowledgments
This image is the copyrighted work of the attributed author or publisher, and
ZFIN has permission only to display this image to its users.
Additional permissions should be obtained from the applicable author or publisher of the image.
Full text @ Dev. Dyn.