
Image
|
Figure Caption
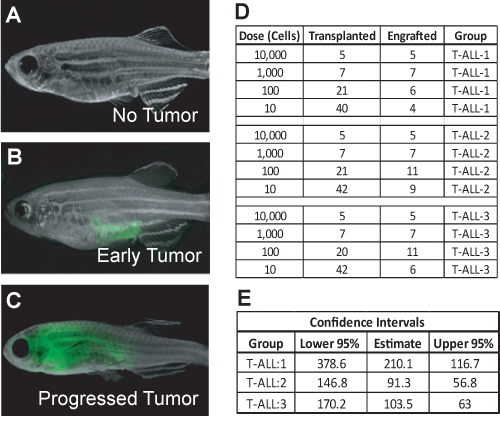
Fig. 3
Zebrafish were examined for leukemia growth 28 days after transplant. Fish are either tumor negative (A), have a small tumor growing at the injection site (B), or have a progressed leukemia (C). The images were taken at 7X magnification. The total number of leukemia-positive fish per total number of fish transplanted at each dilution is recorded, as in (D). The data are input into the web-based ELDA program to calculate the number of self-renewing leukemia cells and the upper and lower 95% confidence intervals (E).
Acknowledgments
This image is the copyrighted work of the attributed author or publisher, and
ZFIN has permission only to display this image to its users.
Additional permissions should be obtained from the applicable author or publisher of the image.
Full text @ J. Vis. Exp.