
Fig. 2
|
Fig. 2
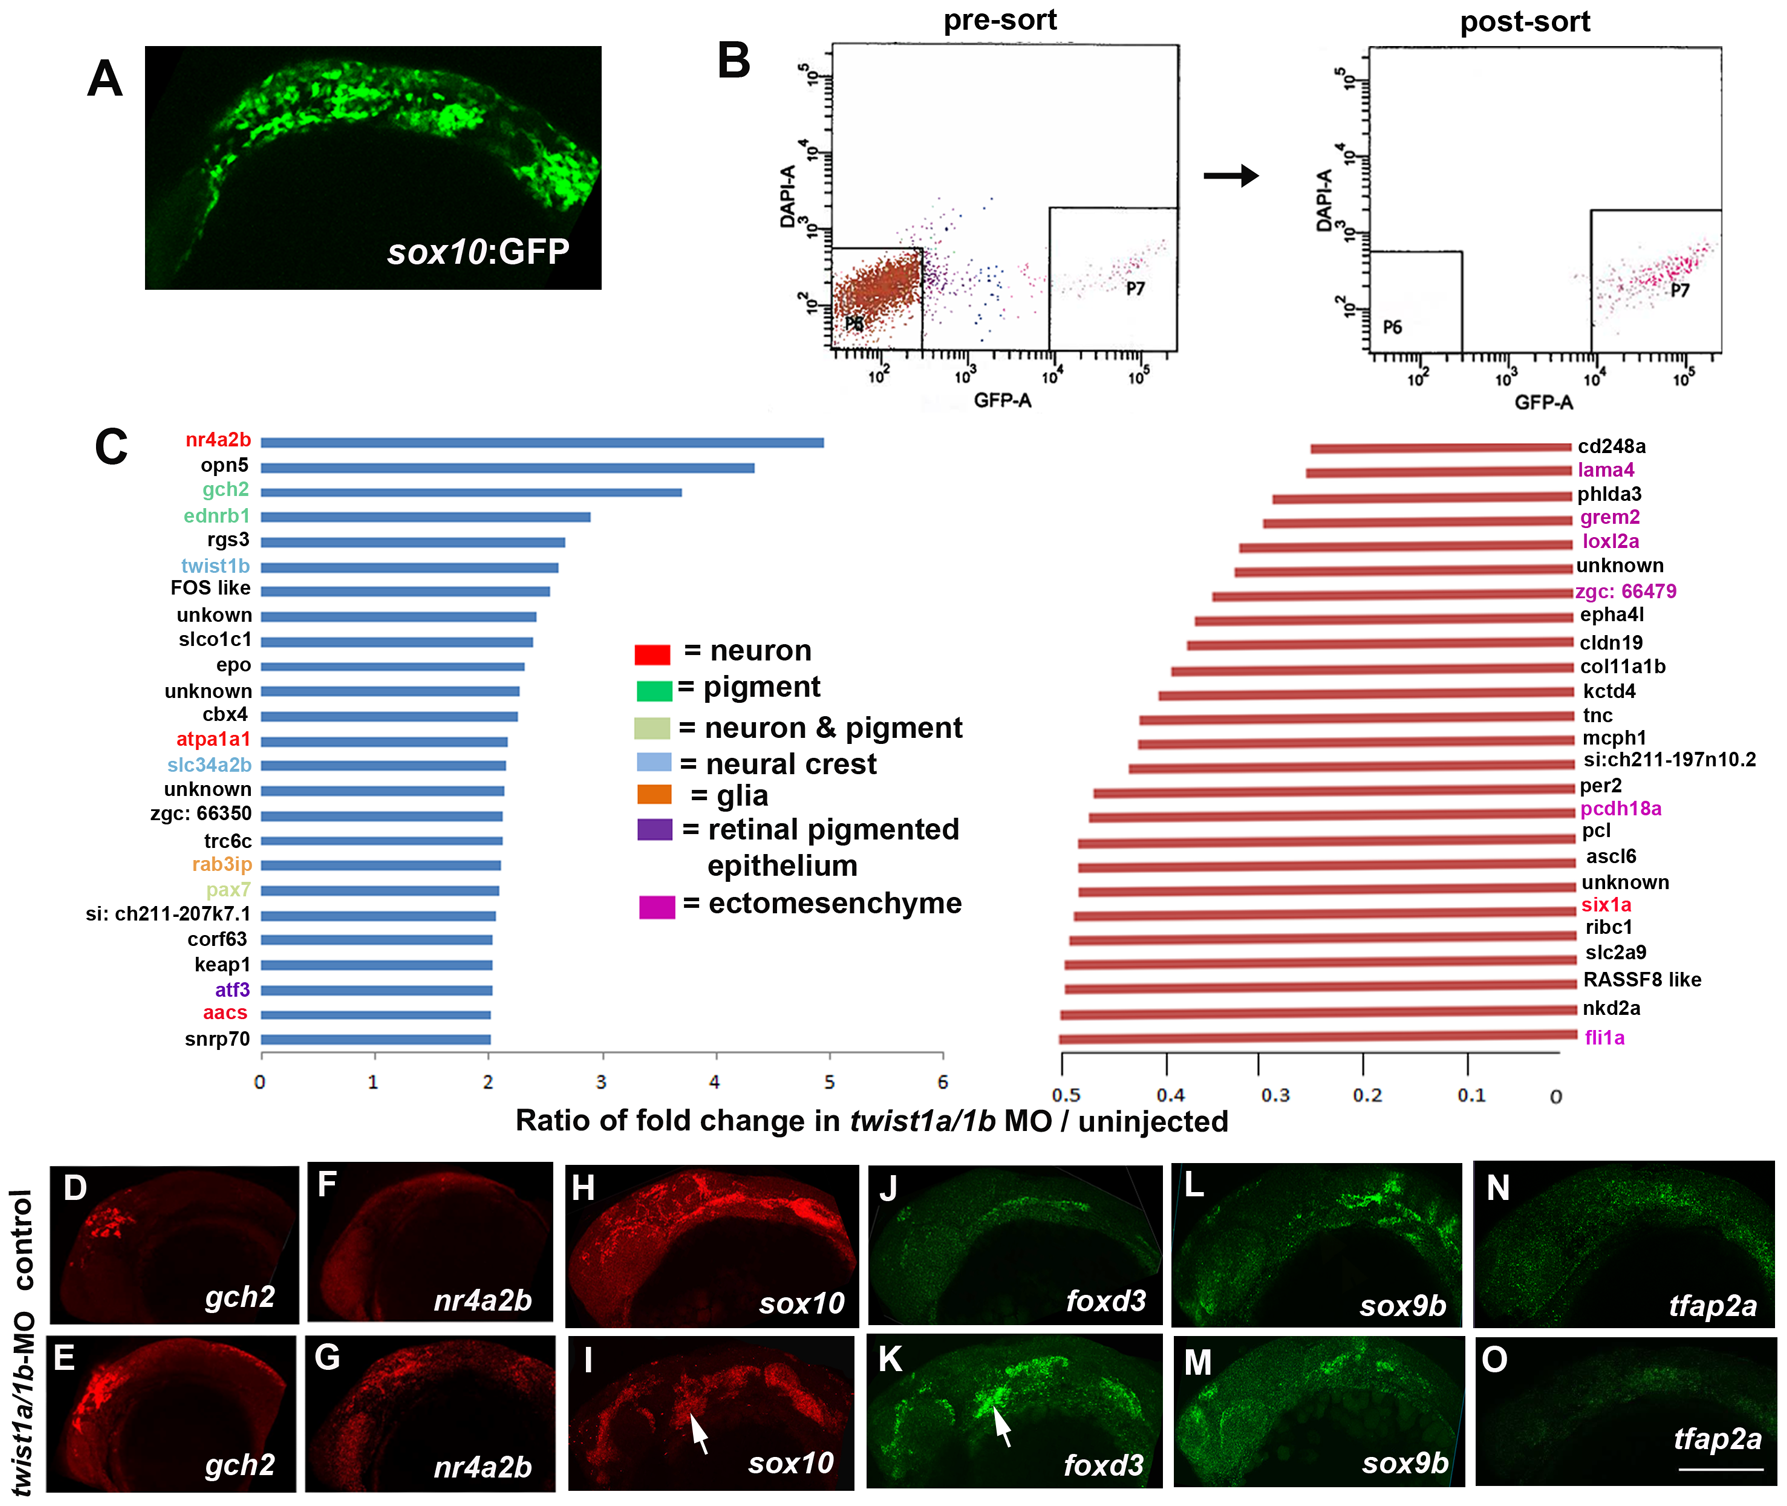
Gene expression profiling in twist1a/1b-MO embryos.
(A,B) sox10:GFP-positive and -negative cells were isolated from un-injected or twist1a/1b-MO embryos at 18 hpf by FACS. (C) Fold changes of the GFP+/GFP ratios between twist1a/1b-MO and un-injected controls show the top 25 up-regulated (blue) and down-regulated (red) genes after Twist1 depletion. Color codes indicate where genes are expressed based on the published literature (see Table S1 for references). (D–O) Confocal projections of fluorescent in situ hybridizations show expanded expression of gch2 and nr4a2b at 18 hpf, ectopic arch expression (arrows) of sox10 and foxd3 at 24 hpf, but no change in sox9b and tfap2a expression at 24 hpf in twist1a/1b-MO versus un-injected controls. Scale bar = 50 μm.