
Image
|
Figure Caption
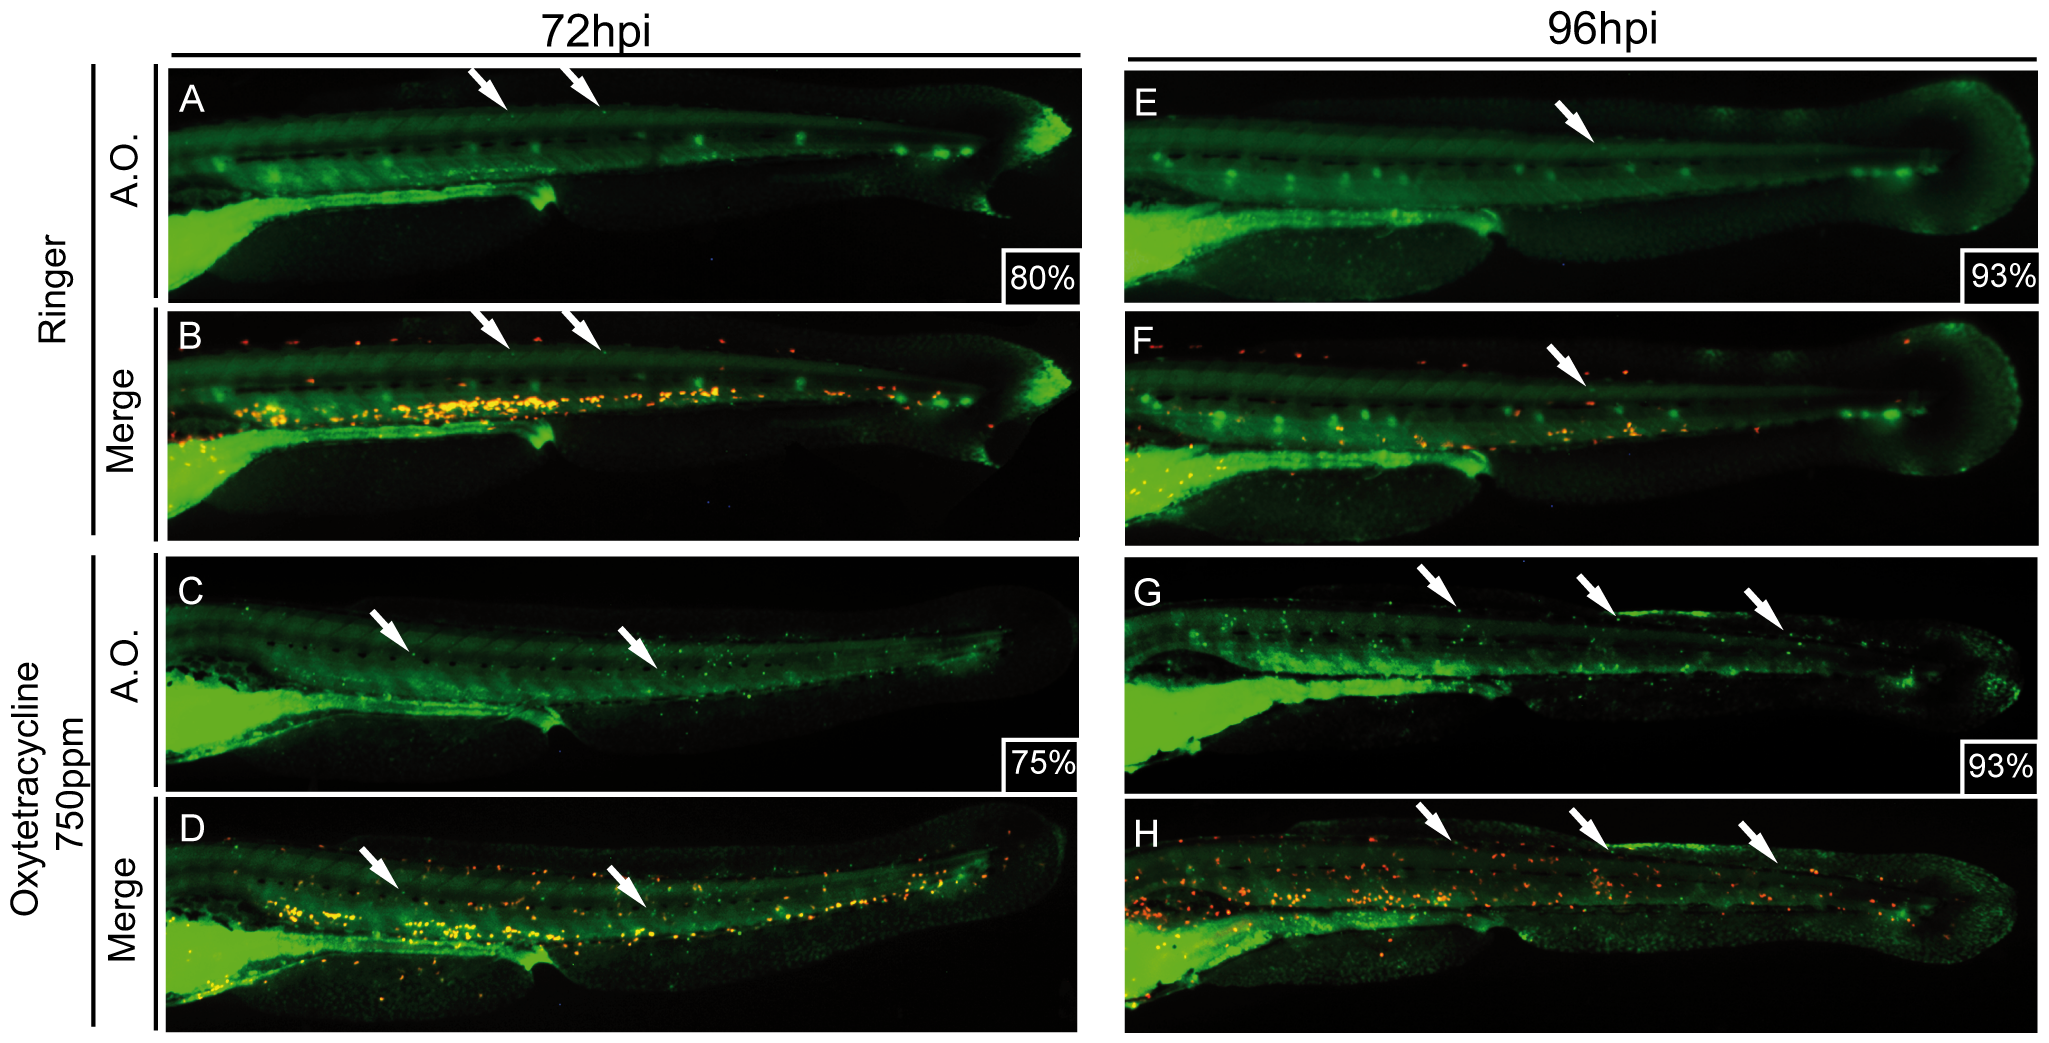
Fig. 3
Cell death is detected in advanced steps of oxytetracycline induced inflammation.
48hpf Tg(LyzC:DsRED2) transgenic larvae were incubated for 72 hrs (A–D) or 96 hrs (E–H) in oxytetracycline 750 ppm followed by an acridine orange stain to address cell death. Experimental larvae showed higher level of cell death (white arrows) compared to control at both time analyzed. The numbers of larvae that presented the phenotype shown is expressed as a percentage.
Acknowledgments
This image is the copyrighted work of the attributed author or publisher, and
ZFIN has permission only to display this image to its users.
Additional permissions should be obtained from the applicable author or publisher of the image.
Full text @ PLoS One