
Image
|
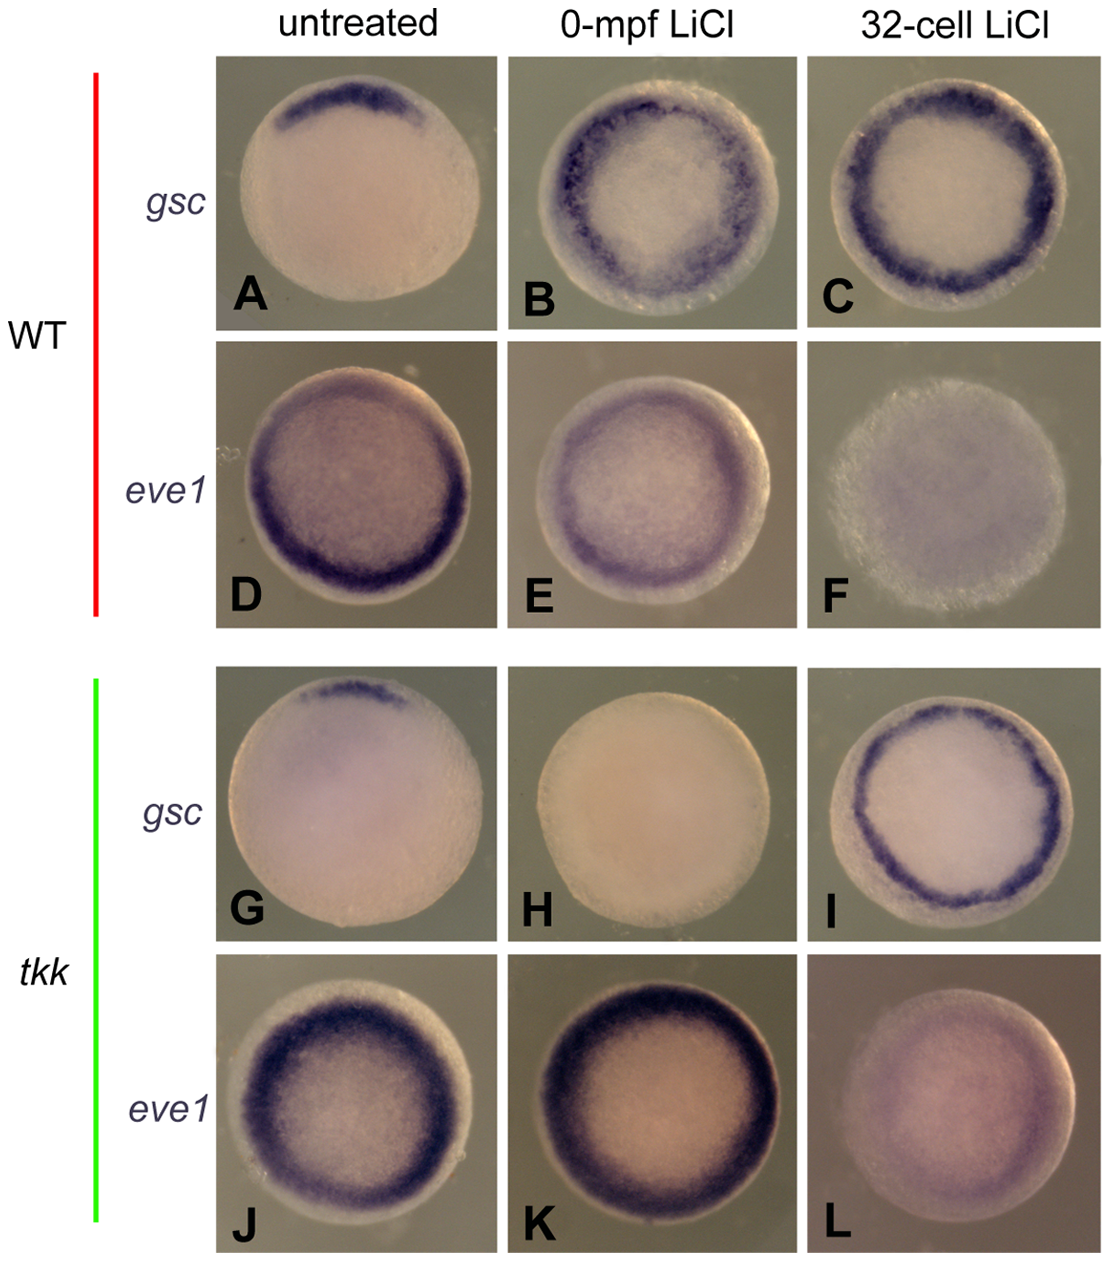
Figure Caption
Fig. 4
The comparison of dorsal and ventral gene expression between 0-mpf lithium treatment and 32-cell-stage lithium treatment.
Representative embryos from indicated groups stained by gsc probe (A–C, and G–I) or eve1 probe (D–F and J–L) at 50% epiboly. All the embryos are animal pole view and with dorsal side upward if it can be distinguished.
Acknowledgments
This image is the copyrighted work of the attributed author or publisher, and
ZFIN has permission only to display this image to its users.
Additional permissions should be obtained from the applicable author or publisher of the image.
Full text @ PLoS One