
Fig. S9
- ID
- ZDB-IMAGE-120316-22
- Publication
- Liao et al., 2012 - Tol2 gene trap integrations in the zebrafish amyloid precursor protein genes appa and aplp2 reveal accumulation of secreted APP at the embryonic veins
- All Figures
- Figures for Liao et al., 2012
|
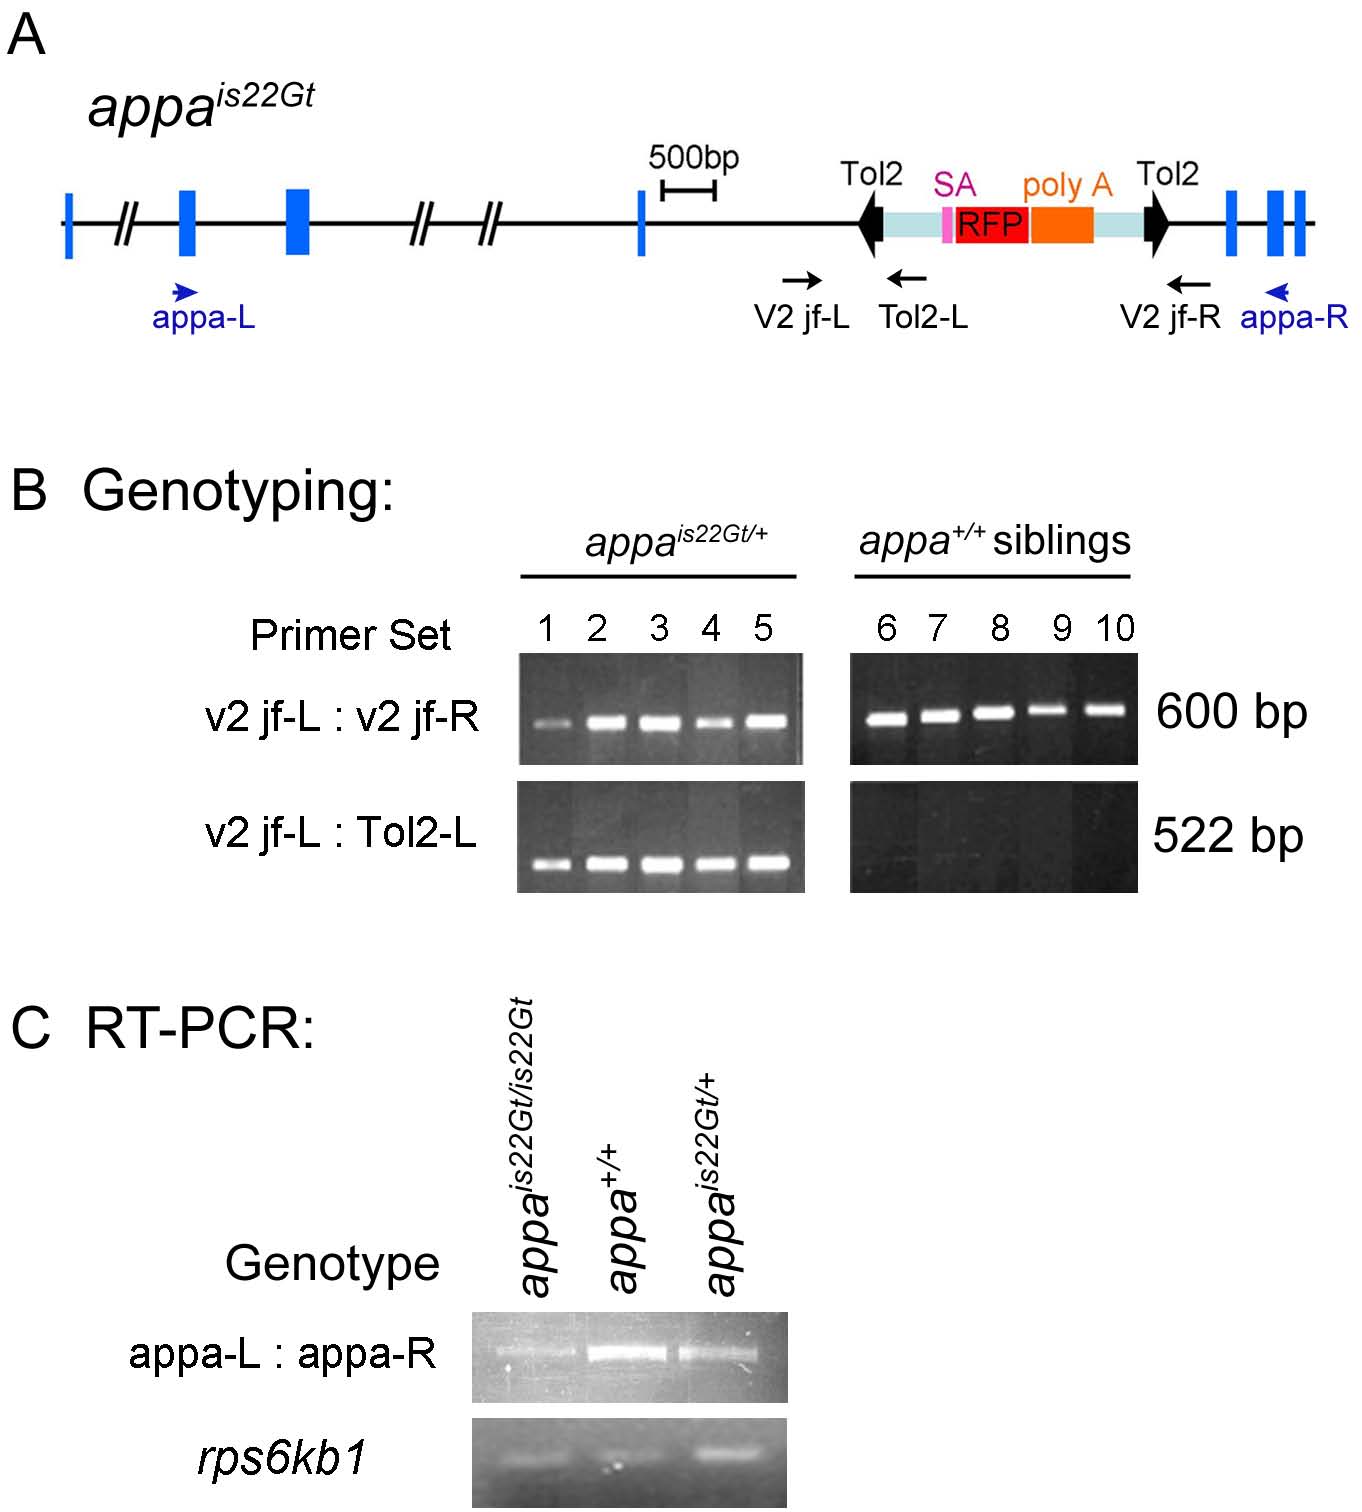
Fig. S9 DNA genotyping and reverse transcriptase-polymerase chain reaction (RT-PCR) analysis of wild-type transcript levels in appais22Gt embryos. A: Structure of the appa locus with is22Gt Tol2 trap integration site. Blue boxes indicate exons. The Tol2 gene trap transposon is shown within bold black arrowheads. Purple, red, and orange boxes indicate the splice acceptor, the RFP cDNA, and the transcriptional terminator / polyadenylation sequence (poly A), respectively. Position and direction of primers for genomic DNA genotyping (black) and RT-PCR analysis (blue) are shown as arrows. B: Genomic DNA genotyping of appa heterozygous embryos and wild-type siblings. Control primers v2 jf-L and v2 jf-R amplify a 600-bp fragment of the wild-type appa gene present in wild-type and heterozygous appais22Gt/+ embryos. A 522-bp fragment spanning the junction of the Tol2 transposon integration site in appa amplifies with the v2 jf-L primer and the Tol2-L primer, which sits inside the left inverted repeat of the Tol2 transposon. The 522-bp fragment is present in heterozygous appais22Gt/+ embryos but absent from wild-type siblings. C: RT-PCR analysis on RNA isolated from appais22Gt homozygous, heterozygous and wild-type embryos. The appa-L and appa-R primers used for RT-PCR sit in exons 4 and 9, respectively, of the appa gene. The normally spliced appa mRNA is amplified by RT-PCR in the homozygous appais22Gt/is22Gt embryos, however, the amount is greatly reduced compared with heterozygous and wild-type embryos. Ribosomal protein rps6kb1 primers were used for control.