
|
Fig. 3
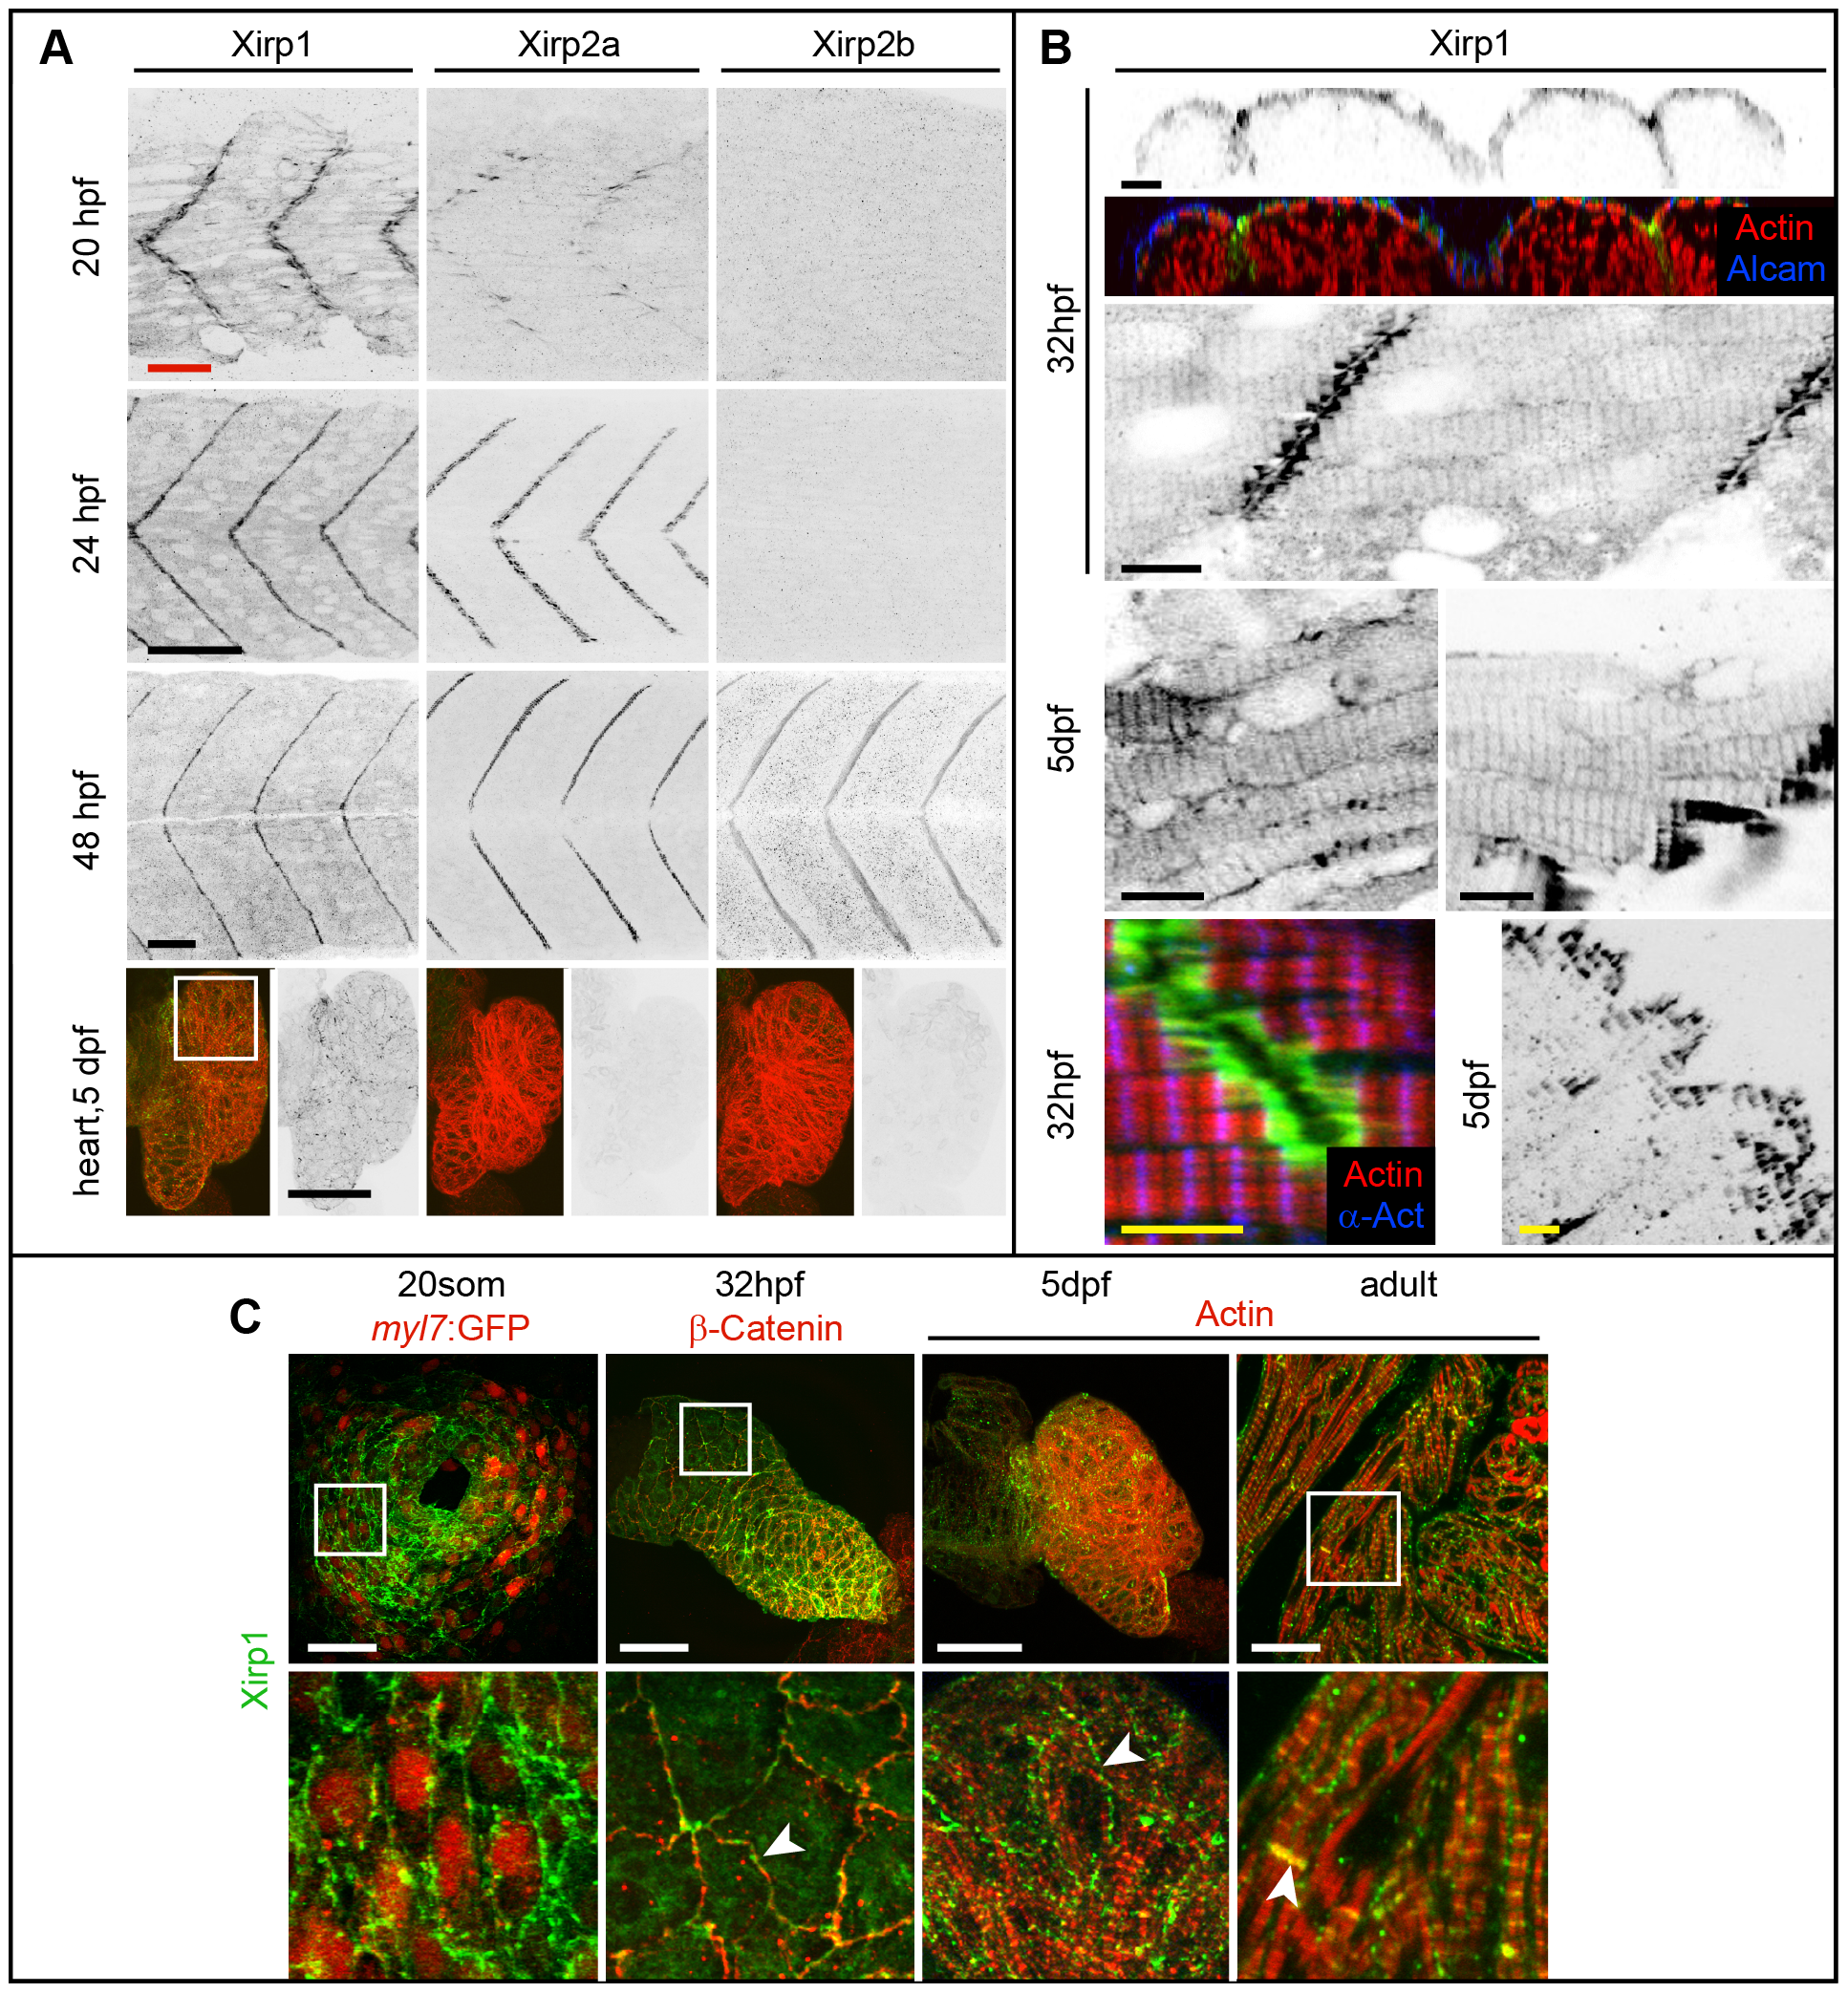
Expression and localization of Xirp proteins during skeletal and cardiac muscle development in WT.
(A) Xirp expression patterns overlap within skeletal muscle between 20–48 hpf. In comparison, only Xirp1 is expressed within the cardiac tissue at 5 dpf. Green: Xirp1, Xirp2a or Xirp2b; red: Actin. Red scale bar: 25 μm, black scale bars: 50 μm. (B) Top panel shows cross section planes of confocal z-scan projections through somitic tissue. Note that Xirp1 (green) is most strongly expressed within the outer layer of slow muscle cells, as marked by Alcam (blue) expression (red: Actin). Whereas most of Xirp1 localizes in a staircase-like pattern to the MTJ, some protein is also detectable in a repetitive pattern at the z-discs of myofibrils and at the lateral plasma membrane, depending on the tissue. Different skeletal muscle types are shown at 5 dpf, whereas somitic muscle is shown at 32 hpf. Green: Xirp1; red: Actin; blue:α- Actinin. Black scale bars: 10 μm, yellow scale bars: 5 μm. (C) Expression and localization of Xirp1 during cardiogenesis and in adult cardiac tissue. Bottom row represents higher magnification images (from inserts, if there is a white box on the top picture) with details on Xirp1 subcellular localization at the ICD of cardiomyocytes (arrowheads). Green: Xirp1; red: myl7:GFP, β-Catenin or Actin. Scale bars: 50 μm.