
|
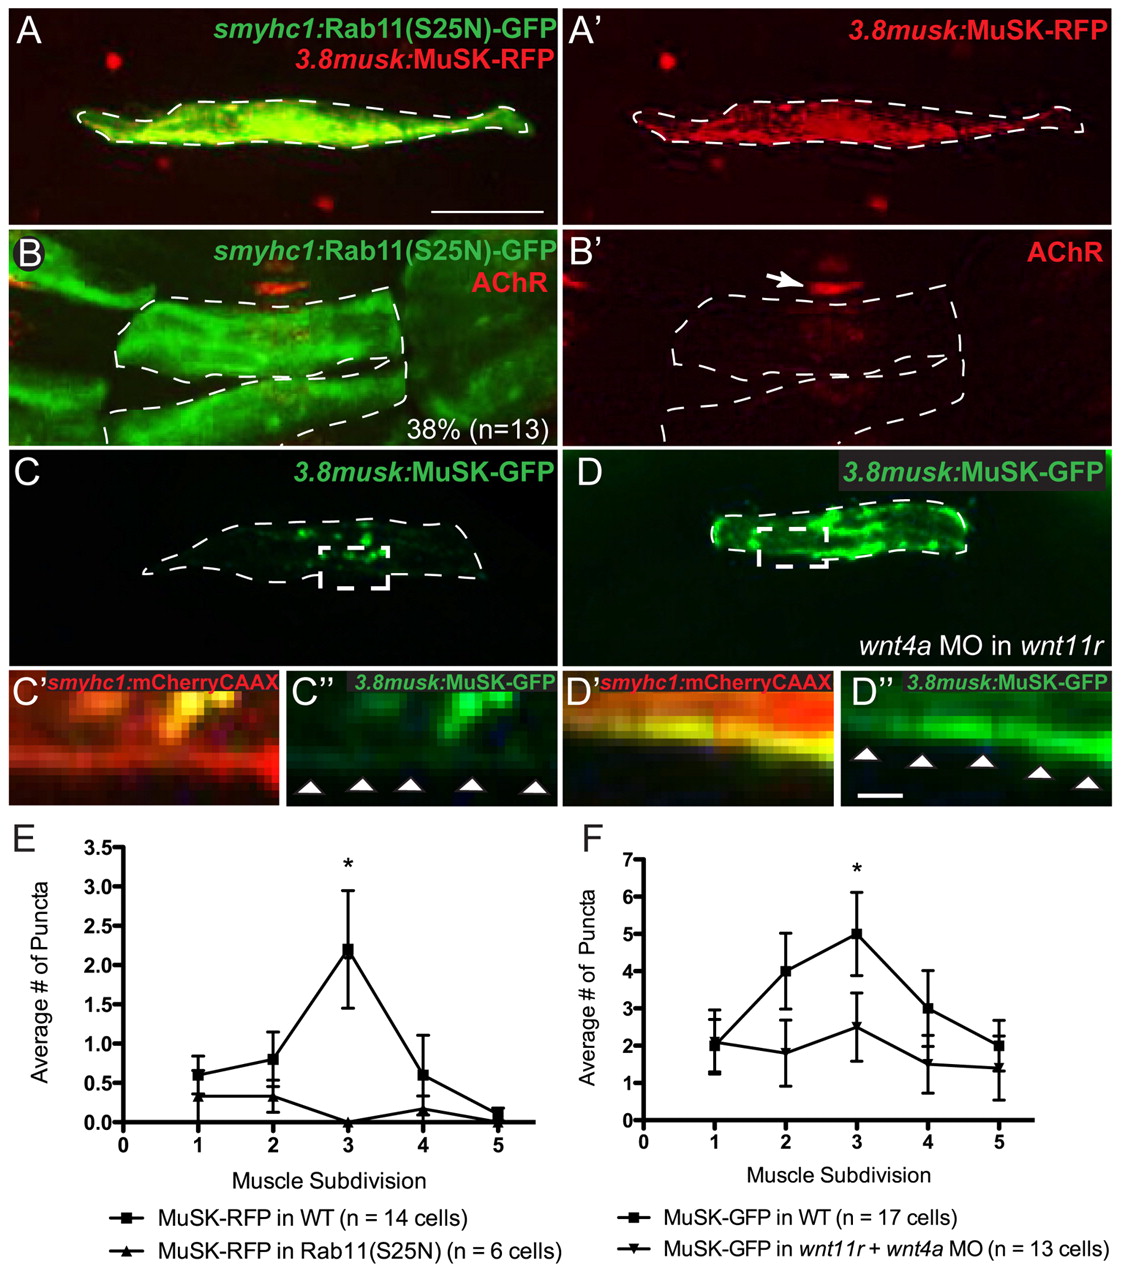
Fig. 4
MuSK trafficking is disrupted in the absence of rab11 and wnt11r/4a. (A,A2) Co-expression of smyhc1:rab11(S25N)-GFP (green) and 3.8musk:MuSK-RFP (red; alone in A2), demonstrating disruption of MuSK-RFP center muscle localization. Instead, MuSK-RFP appears dispersed throughout the cell. (B,B2) smyhc1:rab11(S25N)-GFP (green) expressed in two adjacent muscle cells showing disruption of AChR clusters (bungarotoxin, red) at the interface of the two mosaic fibers but not in an adjacent wild-type cell (arrow). Observed in 38% of cell interfaces, n=13. (C-C3) 3.8musk:MuSK-GFP (green) in a wild-type embryo with normal protein distribution (C) and a magnified view of dashed box showing very little protein at the membrane as visualized with smyhc:mCherryCAAX (C2,C3). (D-D3) 3.8musk:MuSK-GFP (green) in a wnt11r mutant/wnt4a morphant embryo (D), and magnified view of dashed box showing accumulation of protein at the membrane as visualized with smyhc:mCherryCAAX (D2,D3). (E,F) Quantification of central enrichment of MuSK-RFP puncta when co-expressed with Rab11(S25N)-GFP (E) (P values for muscle subdivisions 1-5: 0.6, 0.27, 0.01, 0.38, 0.34, respectively), or when expressed in a wnt11r mutant/wnt4a morphant background (F; P values for muscle subdivisions 1-5: 0.87, 0.12, 0.04, 0.36, 0.97, respectively). *P<0.05. Error bars represent s.e.m. Dashed lines encircle a single muscle cell. Arrowheads (C3,D3) indicate cell membrane. Scale bars: 10 μm in A-D; 1 µm in C2-D3.