
|
Fig. 2
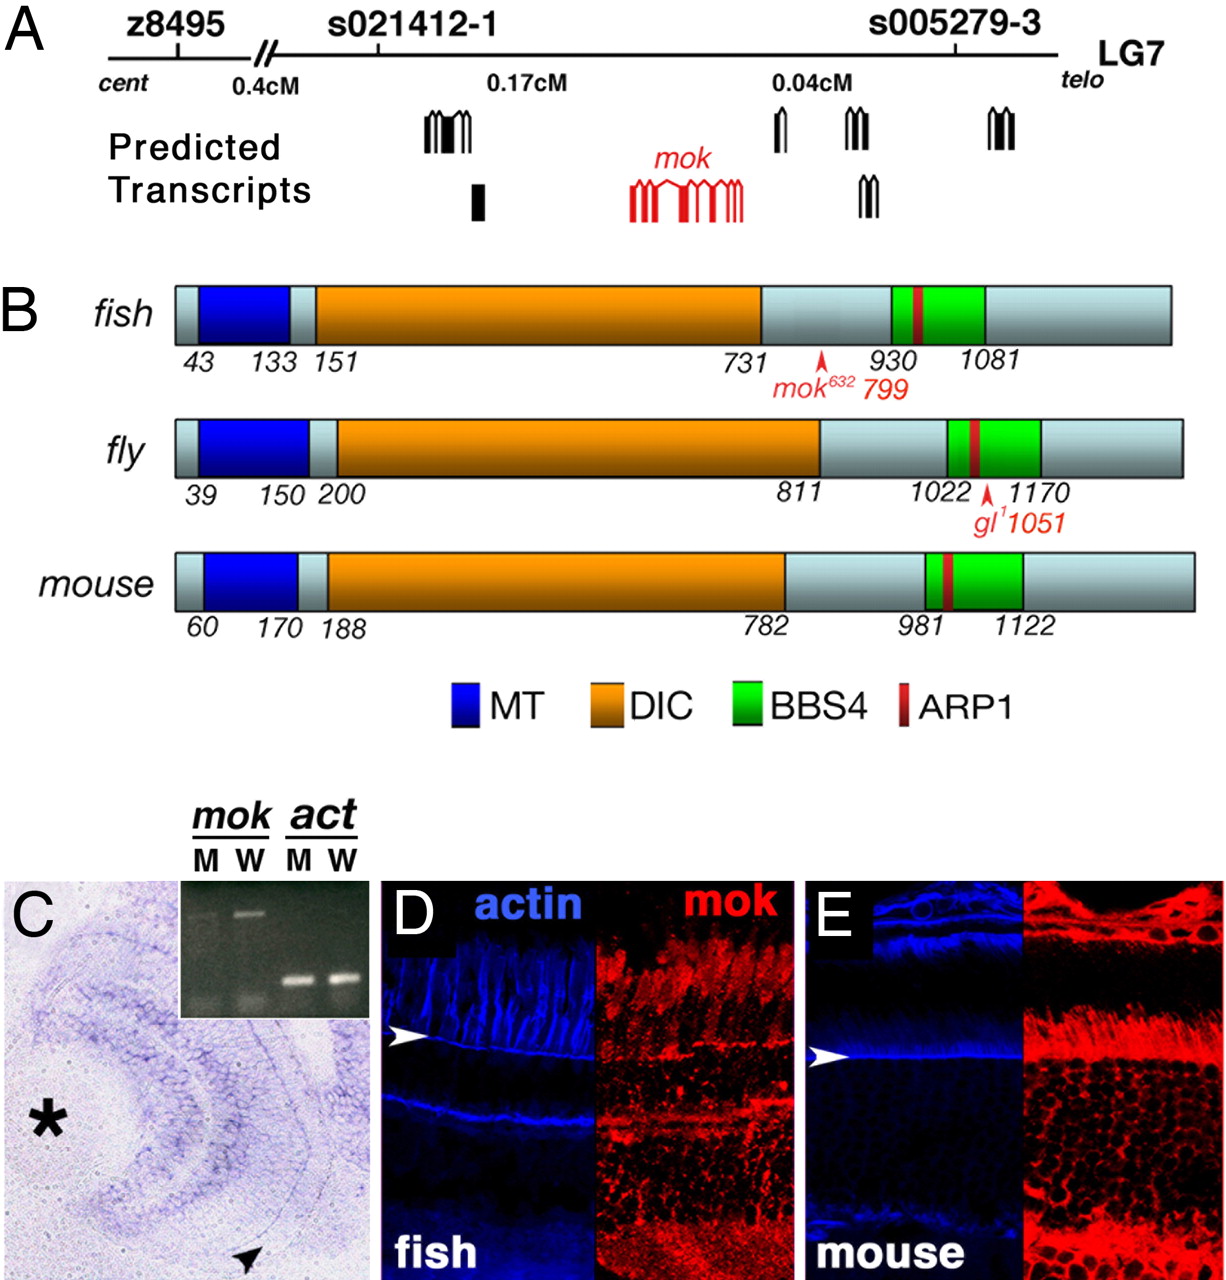
Molecular characterization of the mikre oko (mok) gene. (A) Positional cloning of mok. (B) A schematic diagram of the zebrafish Mok polypeptide in comparison with its Drosophila and mouse homologs. In all three species, Mok polypeptide includes domains thought to bind microtubules (MT), dynein intermediate chain (DIC), actin-related protein 1 (ARP1), and BBS protein 4 (BBS4). In both the zebrafish and the fly, mutant alleles produce C-terminal truncations of the polypeptide (arrowheads). (C) A transverse section through the retina showing mok transcript distribution as evaluated by in situ hybridization. Arrowhead indicates the photoreceptor cell layer, and the asterisk indicates the lens. (Inset) RT-PCR reveals that the mok mRNA level is severely reduced in mokm632 mutant homozygotes, compared with their wild-type siblings. β-actin level (act) is unchanged. (D and E) Mok polypeptide distribution in zebrafish (D) and mouse (E) retinae. (Right) Anti-Mok antibody staining (red). (Left) F-actin distribution (blue). Staining is particularly prominent apical to the outer limiting membrane (arrowheads). In D and E, retinal pigmented epithelium is up.