
Fig. 4
- ID
- ZDB-IMAGE-110812-37
- Genes
- Publication
- Lim et al., 2011 - Motoneurons are essential for vascular pathfinding
- All Figures
- Figures for Lim et al., 2011
|
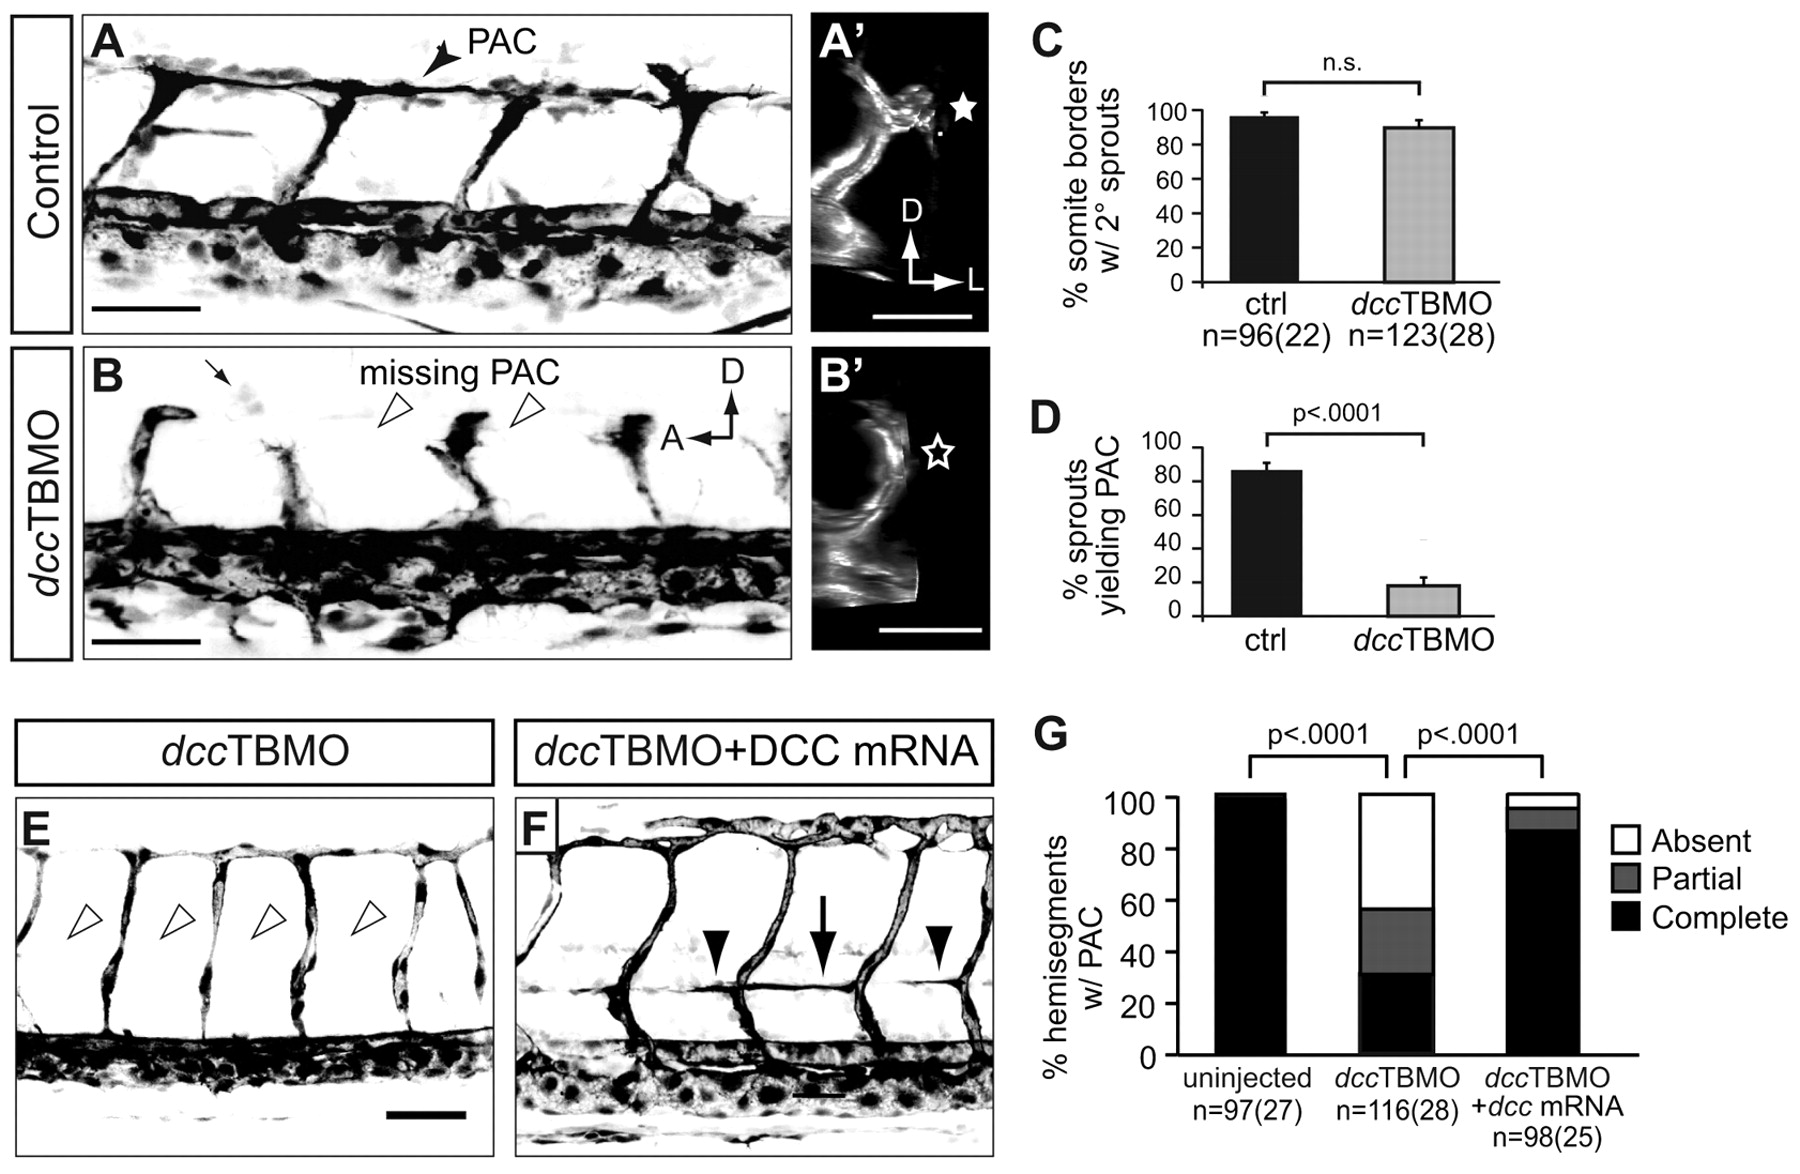
Fig. 4
dcc is required for turning of secondary sprouts at the HMS and injection of dcc mRNA rescues PAC formation in dcc morphants. (A-B2) 48 hpf fli1a:egfpy1 zebrafish embryos injected with (A,A2) plcg1 splice-blocking MO (plcg1SBMO) only (control) or (B,B2) plcg1SBMO plus dcc translation-blocking MO (dccTBMO). (A) Lateral view. In plcg1 morphants, secondary sprouts grow from the PCV and turn at the HMS to form the PAC (arrowhead). (A2) Transverse volume rendering of A showing mediolateral turn of secondary sprout. (star). (B) Lateral view. In embryos co-injected with plcg1SBMO and dccTBMO, secondary sprouts form but fail to turn and form the PAC (arrowheads). (B2) Transverse volume rendering of B showing failure of secondary sprout to turn laterally (star). (C) Secondary sprouts formed from the PCV were counted in 4-5 intersomitic boundaries per embryo between segments 7-11 in plcg1 single morphants (control, 97±3%) and in plcg1SBMO/dccTBMO double morphants (dccTBMO, 90±5%), and showed no significant difference (n.s.). (D) Secondary sprouts that turned to form the PAC were counted in plcg1 single morphants (87±5%) and plcg1/dcc double morphants (18±5%), which showed greatly reduced turning in the absence of Dcc. (E,F) Lateral views of 48 hpf fli1a:egfpy1 embryos injected with (E) dccTBMO or (F) dccTBMO and dcc mRNA. The PAC is absent in dcc morphants (E, arrowheads) and restored when dcc morphants are co-injected with dcc mRNA (F, arrow and arrowheads indicate complete and partial rescue, respectively). (G) Quantification of complete, partial or absent PAC. Uninjected: complete, 99±1%; partial, 1±1%; absent, 0±0%. dcc morphant: complete, 31±7%; partial, 25±6%; absent, 44±7%. dcc morphant + RNA: complete, 86±5%; partial, 9±4%; absent, 5±3%. All values are mean±s.e.m.; error bars show s.e.m.; P-value determined by Mann-Whitney U test (comparing absent PACs in G). n, number of hemisegments (number of embryos). A, anterior; D, dorsal; L, lateral; PAC, parachordal chain. Scale bars: 50 μm.