
|
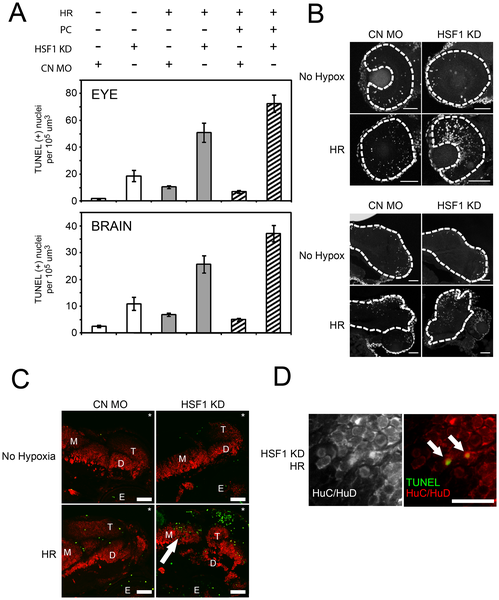
Fig. 5
Effects of HSF1 knockdown on apoptosis.
A: Quantification of TUNEL positive nuclei in the eye and brain of 58 hpf embryos, showing effects of HSF1 knockdown (compare HSF1 KD versus CN MO), in embryos incubated under control conditions (white bars), after hypoxia/reperfusion only (gray bars), and after heat shock preconditioning followed by hypoxia/reperfusion (striped bars). Error bars are the SEM. B: TUNEL positive cells in representative images of eye (upper panels) and brain (lower panels) regions after hypoxia. Dashed lines indicate the region in which nuclei were counted. Scale bars are 50 μm. C: Analysis of brain morphology and apoptosis after HSF1 knockdown. Representative images showing HuC/HuD immunostaining of neurons (red) and TUNEL positive nuclei (green) in brain sections obtained from embryos injected with control (CN) or HSF1 antisense (HSF1 KD) MO and incubated in normoxic medium (No Hypoxia) or exposed to hypoxia and reperfusion (HR). Asterisks mark the dorsal, anterior aspect of the embryos. Labels are telencephalon (T), midbrain (M), diencephalon (D), and eye (E). Scale bars are 50 μm. D: Representative higher magnification images showing localization of markers for neurons and apoptotic cells in cryosectioned brain. Scale bars are 10 μm.